About Me
Numbers have always been my thing, ever since school. I even got a distinction in my Master's degree in Mathematics (honors!). During my academic journey, I published two research papers in international journals, showcasing my ability to draw meaningful conclusions. This journey taught me how to break down complex problems and explain them in a clear, concise way. Numbers have the power to make anything significant or an absolute disaster. Kind of like how changing the digits in your age can completely rewrite your story!
But numbers weren't enough on their own. I craved the challenge of using them to understand the world around us. My love for numbers really goes beyond this – I absolutely love analyzing things, I see patterns everywhere, even in nature! To fuel this passion, I've done 5 internships as a data analyst and business analyst, working on over 15 projects. Being named "Best Performer" at CognoRise InfoTech during my internship was a huge confidence boost!
But the learning doesn't stop there. I've also completed over 40 personal projects using tools like SQL, Python, Power BI, Excel and Tableau. These projects covered everything from exploring data (EDA), scraping websites to sentiment analysis, optimizing customer engagement and building clear, informative dashboards.
Numbers aren't the only things that talk. I believe in the power of clear communication. During a presentation at KultureHire, I was praised for my ability to effectively distill complex data into clear, actionable insights and research skills that exceeded expectations. Sharing my research at international conferences has also been incredibly rewarding, even leading to the publication of one of my papers.
Sharing knowledge is my another passion. That's why I started my blog, "Tiny Data Universe". It's my way of making data analysis approachable and relatable and showing everyone that data analysis isn't scary - it's actually a fun way to understand the world around us!
Here's another thing, data isn't just about numbers - it's about understanding the world and how things work. And that connection between data and success is what drew me to the business world. Just like numbers tell stories, businesses do too! Business itself has become a fascination for me. Plus, I have a whole section dedicated to making business ideas easier to understand, because let's face it, business success is a bit like figuring out life itself, right?
My math background gave me the analytical muscle memory and the problem-solving skills. It let me dissect data and find the hidden connections and patterns while my experience as a tutor and volunteer taught me to speak the language of people, not just spreadsheets. Because data deserves a voice, not just silence. And my artistic soul? It gave me the ability to see the bigger picture, the depth of meaning beyond the numbers. It makes me see the story, the humor, the life in every dataset. The business knowledge gives me the power to think about what businesses need and not just mindlessly analyze things!
So, here I am, Muskan Kashyap, a data analyst/ business analyst who wants to translate the whispers of numbers into actionable stories and to help businesses see the world through their data.
If you're looking for a data analyst or a business analyst who can crunch numbers, see the big picture, think about your business and tell a story with them, let's connect!
Education
MASTERS OF SCIENCE IN MATHEMATICS (HONS.) – Lovely Professional University (2021-2023)
CGPA: 9.15/10 (First Division with Distinction)
BACHELORS OF SCIENCE IN MATHEMATICS (HONS.) – Lovely Professional University (2018-2021)
CGPA: 8.65/10 (First Division)
Experience
Business Analytics Intern – Cognifyz Technologies
Feb 2024 – March 2024
- Leveraged Python libraries (Pandas, Matplotlib, Seaborn) to perform comprehensive exploratory data analysis (EDA) on investment avenues data, extracting actionable insights.
- Employed PowerBI's Power Query to preprocess data effectively, enabling the creation of a dynamic dashboard showcasing demographic insights, investment avenue preferences, and key motivations for investment.
- Contributed valuable insights to business strategy by analyzing investment trends, facilitating informed decision-making, and demonstrating the significance of data-driven approaches in optimizing capital allocation and strategic planning processes.
Data Analyst Intern – KultureHire
Dec 2023 – Feb 2024
- Utilized Excel (VLOOKUP, INDEX, MATCH, Pivot Tables, Conditional Formatting, Macros) to create multiple dashboards and PowerBI (Measures, Power query) to develop dashboards using extensive data from multiple tables, each containing 3000+ records.
- Managed end-to-end data analysis, including data collection through Google Forms, MYSQL-based analysis, dashboards in Power BI and storytelling for insightful presentations. Provided meaningful employer recommendations with a narrative emphasis.
Data Analyst Intern – CognoRise InfoTech
Jan 2024
- Analyzed nutritional content in a cereal dataset using Python (pandas, matplotlib, seaborn), extracting key insights and communicating findings through effective data visualization.
- Utilized SQL skills for data manipulation and analyzed 8500+ rows of dataset, utilizing CASE statements, aggregations, window functions, and CTEs in a complex retail dataset.
- Designed and implemented an interactive Power BI dashboard to visualize unemployment trends in India, transforming raw employment data into meaningful visualizations.
Data Analyst Intern – Psyliq
Dec 2023 – Jan 2024
- Analyzed a 100,000+ row diabetes dataset using PostgreSQL, extracting key insights for enhanced healthcare data understanding.
- Manipulated a 4000-employee dataset in Excel, utilizing VLOOKUP, INDEX, MATCH, and Macros to streamline processes and boost efficiency.
- Conducted detailed analysis of a 4400+ row HR dataset with Excel and Power BI (DAX, Relationship Establishment, Data Visualization). Delivered actionable insights for informed decision-making.
Data Analyst Intern – MeriSkill
Nov 2023 – Dec 2023
- Analyzed 185,000+ rows of sales data using Power BI, identifying trends, top-selling products, and calculating revenue metrics. Used data manipulation for effective visualizations, aiding strategic decision-making.
- Cleaned and transformed HR data in Power BI, including data grouping, column operations and duplicate handling. Utilized Power BI for visualizing correlations between HR factors, enhancing talent management and organizational performance.
Student Researcher – Lovely Professional University
Jun 2020 - May 2023
- Published two impactful scientific papers in international journals during undergraduate and postgraduate studies.
- Conducted rigorous mathematical analysis using MATLAB and Excel, presenting findings at global conferences like RAFAS 2021 and RAFAS 2023.
Publications
Private Tutor (Self Employed)
Jan 2019 – May 2021
- Empowered 15-20 high school students (grades 9-12) through targeted Mathematics tutoring, achieving a noteworthy 15-20% improvement in academic performance.
- Applied data-driven insights to customize lesson plans, resulting in consistent marks between 75-90 and earning positive feedback from students and parents, showcasing adept analytical and communication skills.
Projects

Secrets of Severus Snape: Web Scraping and Sentiment Analysis || Python
Data Behind Your Groceries: BigMart || SQL
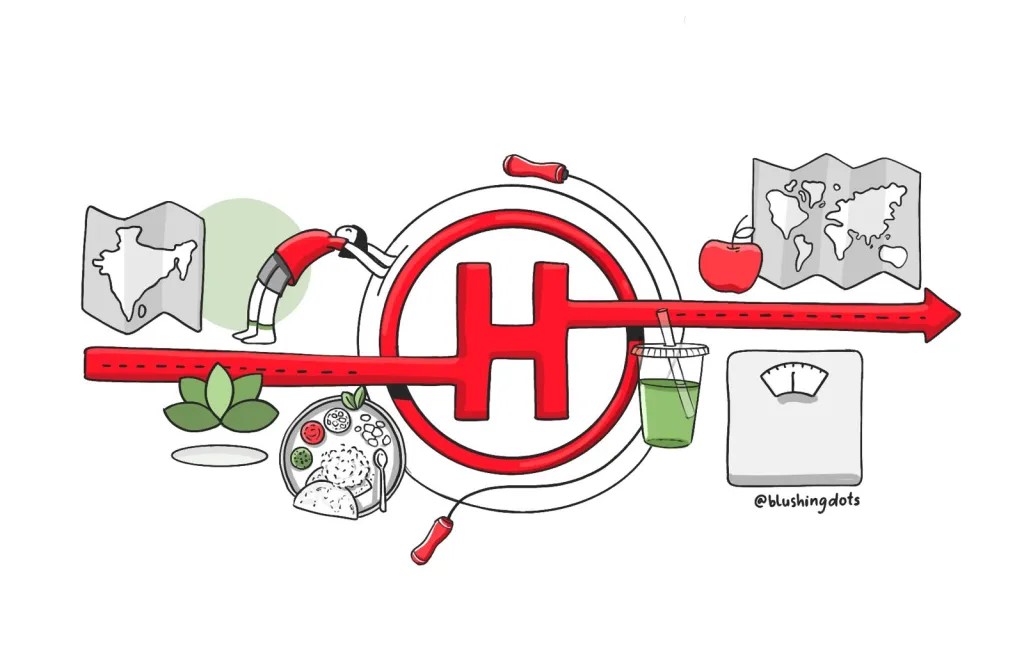
Optimizing Customer Engagement and Conversion Rates: HealthifyMe || SQL
Battle of the Streaming Giants: Netflix vs. YouTube || Tableau
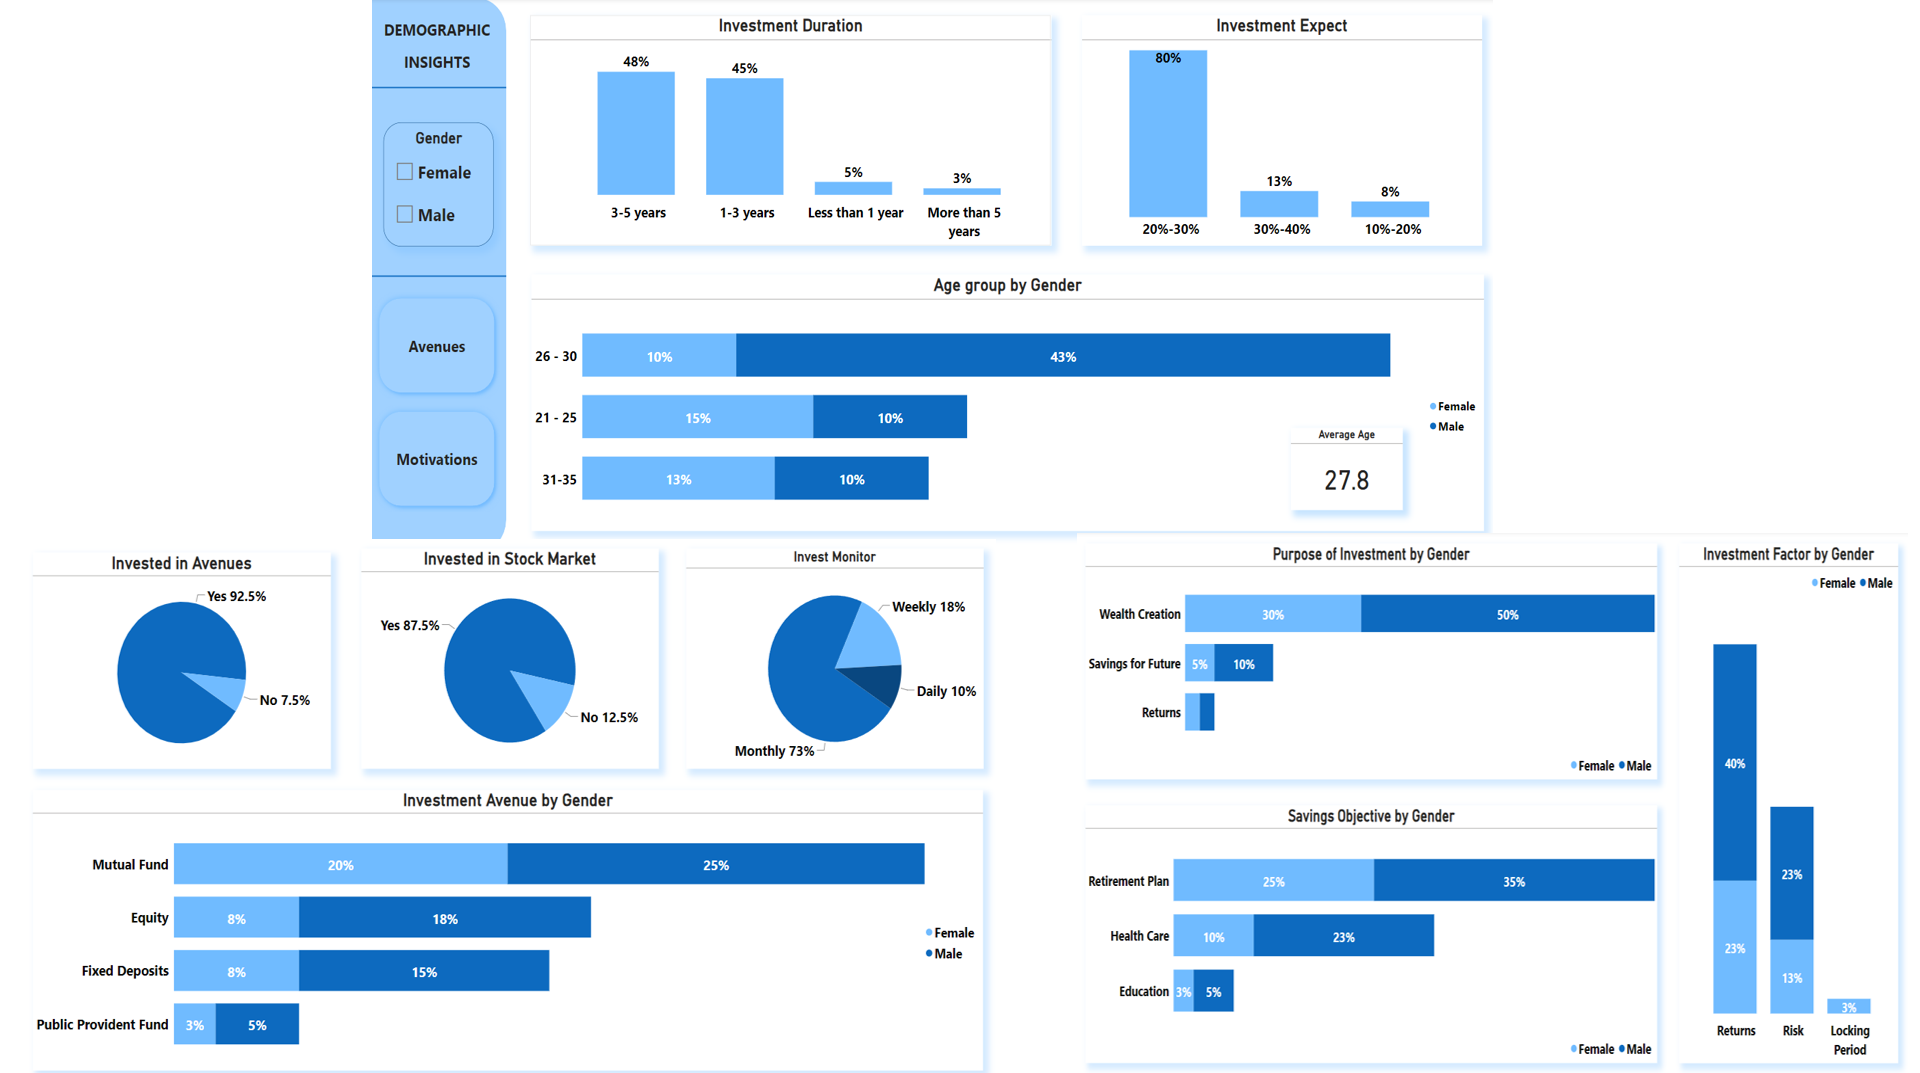
Investment Avenue Analyzer || Power BI

Turn your Customer Insights into Business Gold! || Excel
Project-1
Secrets of Severus Snape: Web Scraping and Sentiment Analysis || Python
Remember those enchanting Saturday nights, huddled with siblings, bewitched by the cinematic wonders of Harry, Hermione, and Ron? The Harry Potter movies were more than just films; they were the cornerstone of our childhood, weaving a tapestry of friendship, courage, and magic. From the moment Hagrid uttered those unforgettable words, "You're a wizard, Harry," we were hooked. From the bustling corridors of Hogwarts to the enchanting forbidden forest, the movies were a visual feast.
But how this fits in your puzzle?
Businesses crave stories behind their customers, and that's where I come in! Imagine this:
- Want to know how customers *really* feel about your product? I can scrape reviews, analyze the emotions, and aha! You've got a magic potion of insights to improve it.
- Lost in a sea of social media comments? No worries! I can untangle the mess and reveal what people are *truly* saying.
- Stuck in a marketing rut? Fear not! I can decode the most powerful words that resonate with your audience, casting spells of attraction and boosting your brand.
Let's continue this journey!
Objective
My goal was to unravel the mysteries of Professor Snape from the Harry Potter series using web scraping and sentiment analysis techniques. Through this magical coding adventure, I aimed to understand Snape's emotional landscape and uncover the most enchanted words that defined his story.
Chapter 1: The Sorcery of Web Scraping
I employed the art of web scraping to gather Snape's story from a special webpage. Picture it like sending a coded owl to fetch a letter, but instead, we fetched paragraphs filled with Snape's tales. Using magical tools like BeautifulSoup and NLTK, I transformed these paragraphs into a neat scroll, saved in a CSV file.
Chapter 2: The Potion for Sentiment Analysis
This is where the real magic happens! I delved into Snape's sentiments using the SentimentIntensityAnalyzer potion. By assigning magical labels like 'angry' or 'protective,' I unveiled the emotions that weave through Snape's narrative. The results painted a captivating picture—Snape's worries took the lead, followed by contempt, anger, and a strong sense of protectiveness.
Chapter 3: Discovering the Most Magical Words
Summoning the top words echoing in digital Hogwarts, I created a playlist of wizarding hits: Snape, Harry, Dumbledore, Voldemort, and Lily. It's like decoding Snape's favorite spells. Filtering mundane words and lemmatizing for simplicity, I uncovered the essence of Snape's story.
Key Insights:
Snape's Emotional Landscape
The sentiment analysis potion unveiled the layers of Snape's emotions. From the depths of worry to the heights of
protectiveness, Snape's sentiments paint a portrait of a character as complex as the enchanted dungeons of
Hogwarts.
- Worry takes the lead with 22.51%, reflecting Snape's perpetual concern in the wizarding saga.
- Contempt and anger follow closely at 19.32% and 14.94%, capturing Snape's moments of disdain and frustration.
- Protectiveness stands tall at 10.06%, showcasing the guardian within Snape.
- Sarcasm, sacrifice, ambiguity, and affection weave through his narrative, each adding a unique hue to the canvas
of his emotions.
Snape's Incantations — Top 5 Magical Words
- The word 'Snape' appears 703 times. As expected, the enigmatic Potions Master is at the center of his own tale.
- Harry, Dumbledore, and Voldemort make appearances, emphasizing the interconnectedness of Snape's story with the
broader wizarding world.
- The name 'Lily' blooms, reminding us of the poignant ties woven into Snape's complex narrative.
Conclusion:
In this magical coding journey, Snape's layers unfolded like a digital scroll. The code spilled the tea on Snape's feelings and the words that made him the wizard we love (and maybe secretly roll our eyes at). It's like unlocking the secrets of the Half-Blood Prince himself!
Project - 4
Battle of the Streaming Giants: Netflix vs. YouTube || Tableau
Ah, Netflix and YouTube, the two titans of our screen time. They're like the sun and moon of the entertainment universe, ruling our nights and days with their endless streams of videos.
Imagine a cozy armchair, a warm blanket, and a bottomless pit of shows and movies. That's Netflix. It's the land of curated content, where algorithms know your deepest desires before you even do. Want a tearjerker rom-com? Boom, it's there. Craving a documentary about competitive yodeling? Netflix has got you covered (seriously, there's one).
Now picture a bustling street market, overflowing with sights, sounds, and everything in between. That's YouTube. It's the wild west of videos, where cat videos rub shoulders with educational lectures and conspiracy theories about the Illuminati (don't judge, we've all been down that rabbit hole). You can learn how to knit a scarf, fix a leaky faucet, and literally anything.
But do you ever wonder who reigns supreme?
These two titans of streaming have carved their own paths to our eyeballs, offering entertainment, education, and even ways to earn a living. But which one is king (or queen) of the content castle?
But how this fits in your puzzle?
The epic battle between Netflix and YouTube! Turns out, your business is facing similar showdowns every day!
Just like I cracked the code on who reigns supreme in the streaming, I can help you decode the mysteries hidden within your own data. This is how I can help you!
Spot the gold:
I'll show you where the untapped opportunities are hiding in your data, so you can grab them before your competitors do.Dodge the traps:
I'll help you identify potential threats early on, so you can steer clear of trouble and keep your business safe.Make sense of the numbers:
No more confusing charts and graphs! I'll turn your data into easy-to-understand pictures that even your goldfish can understand (metaphorically speaking, of course!).Tell a winning story:
Don't worry if you speak fluent "mumbo jumbo" and your team speaks "marketing jargon." I'll be your trusty translator, turning complex findings into clear, compelling stories that everyone can understand.
Let's continue this journey!
Objective
My mission: uncover the revenue streams, user bases, and hidden trends of these streaming giants. I began my data-driven journey using Tableau to answer the burning questions:
- Who rakes in more cash?
- Is everyone on YouTube or Netflix?
- What's the deal with YouTube Premium's meteoric rise?
- Is Netflix losing ground, or just taking a dramatic detour?
Buckle up, folks, because the results are surprising!
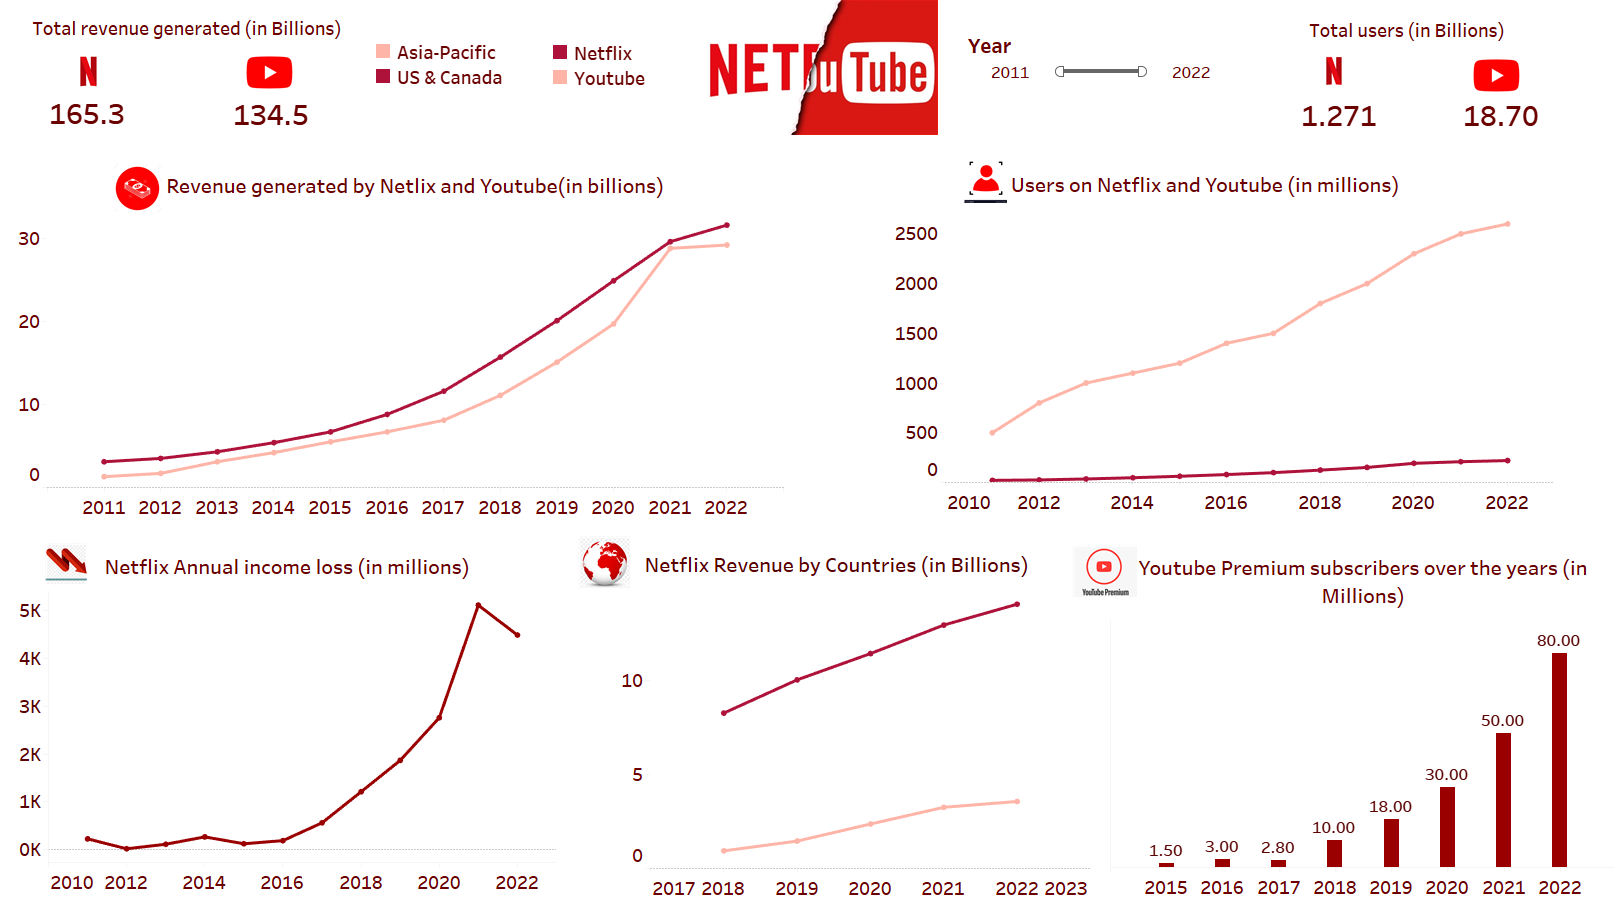
Round 1: Revenue Showdown!
Netflix may be the heavyweight with $165 billion in total revenue, but YouTube punches back with its massive user base and ad dollars, bringing in a respectable $135 billion. It's like Netflix is the luxurious restaurant with a limited clientele, while YouTube is the bustling street food stall for the masses
Round 2: User Uprising
YouTube takes the user crown by a landslide (Need numbers? It’s 18 billion!!). More people are jamming to cat videos and learning DIY hacks than settling in for a Netflix marathon (Merely 1 Billion!). It's like everyone has a YouTube account, while Netflix subscriptions are still a special treat.
Round 3: Premium Powerhouse
Remember when everyone laughed at YouTube Premium? Not anymore! Those subscribers shot from 1 million in 2015 to a whopping 80 million in 2022! Talk about a glow-up! This shows that people are willing to pay for ad-free streaming and exclusive content.
Round 4: Geography Games
Turns out, Netflix's biggest fans live in the USA and Canada. Those two countries together are like Netflix's personal ATM. Think red carpets, maple syrup, and endless binge-watching
Round 5: The loss Rollercoaster
Hold onto your popcorn! Netflix's annual losses took a wild ride between 2018 and 2021, with ups and downs as dramatic as any cliffhanger in "Stranger Things." This just proves that even the streaming giants have to navigate their own challenges
Conclusion
So, who wins the crown? Well, that's like asking who wins, pizza or tacos? They're both delicious, just in different ways. Netflix is your reliable best friend, always there with a comforting shoulder (or binge-worthy show) when you need it. YouTube is the crazy, unpredictable cousin who introduces you to new and bizarre things you never knew existed. Both YouTube and Netflix rule different parts of the streaming kingdom. One for the masses, one for the discerning, both leaving us entertained, informed, and maybe even a little addicted. Each has its own strengths and weaknesses, and both are constantly evolving.
Ultimately, the winner is... you! You get to choose your own adventure, whether it's a carefully curated Netflix marathon or a wild YouTube rabbit hole expedition
This project was my data-driven adventure into the world of streaming. I used skills like:
- Data analysis: I wrangled and analyzed data from various sources.
- Visualization: I turned those numbers into colorful graphs and charts that anyone could understand, even if they can't tell the difference between a bar graph and a pie chart.
- Storytelling: I made the data come alive with insights and humor, because who wants to read a boring data dump?
Project - 6
Turn your Customer Insights into Business Gold! || Excel
Imagine you're running a business. Customers are the lifeblood of your company, and keeping them happy is crucial. That's where customer service comes in. It's the magic touch that turns satisfied customers into loyal fans. But how do you know if your customer service is hitting the mark? That's where this project comes in.
Objective
This Excel project is about creating a customer service dashboard that sheds light on what's really happening in the world of your customer support team. It's like having a superhero X-ray for your customer service, letting you see strengths, weaknesses, and opportunities to improve.
Chapters
- Customer Satisfaction: We peered into the minds of the customers, using star ratings and feedback to gauge their happiness.
- Agent Performance: We tracked the customer service heroes, seeing who consistently delivered smiles and solved problems like a champ.
- Interaction Channels: We examined how customers reach out, whether it's by phone, email, or live chat, to see which methods make them happiest.
- Top Trends: We identified patterns and insights hidden within the data, like which days see the most interactions or which issues cause the most frowns.
Key Insights
- Customer Champions:
- Requests shine: Not only did they win big with a 7.2 out of 10 satisfaction rating, but they also snagged the most customers, with a whopping 53% choosing them. Clearly, Requests keep their fans smiling!
- Adrien aces it: This superstar agent consistently crushes satisfaction goals, boasting a monthly average of 7.3 out of 10. No wonder customers love him!
- Interaction All-Stars:
- Summer surge: June saw the most interactions. Was it a hot product launch or just the summer heat driving things up?
- Seasonal shifts: Roach Cousineau ruled the summer months, handling the June-August rush like a champ. Adrien took the crown in September, proving this team has all seasons covered!
- Deeper Dives:
- August blues: In August, daily satisfaction took a noticeable dip. Time to investigate what happened and turn those frowns upside down!
Conclusion
This customer service dashboard is your secret weapon for understanding your customers and delivering the kind of service that makes them sing your praises. Use it to identify areas for improvement, celebrate your star agents, and keep your customers coming back for more. Remember, happy customers are loyal customers, and loyal customers are the key to business success!
Get in touch
Let's chat! Your data, my brain - together we can be unstoppable.
India (Open for Relocation)
Elements
Text
This is bold and this is strong. This is italic and this is emphasized.
This is superscript text and this is subscript text.
This is underlined and this is code: for (;;) { ... }. Finally, this is a link.
Heading Level 2
Heading Level 3
Heading Level 4
Heading Level 5
Heading Level 6
Blockquote
Fringilla nisl. Donec accumsan interdum nisi, quis tincidunt felis sagittis eget tempus euismod. Vestibulum ante ipsum primis in faucibus vestibulum. Blandit adipiscing eu felis iaculis volutpat ac adipiscing accumsan faucibus. Vestibulum ante ipsum primis in faucibus lorem ipsum dolor sit amet nullam adipiscing eu felis.
Preformatted
i = 0;

while (!deck.isInOrder()) {
    print 'Iteration ' + i;
    deck.shuffle();
    i++;
}

print 'It took ' + i + ' iterations to sort the deck.';
Lists
Unordered
- Dolor pulvinar etiam.
- Sagittis adipiscing.
- Felis enim feugiat.
Alternate
- Dolor pulvinar etiam.
- Sagittis adipiscing.
- Felis enim feugiat.
Ordered
- Dolor pulvinar etiam.
- Etiam vel felis viverra.
- Felis enim feugiat.
- Dolor pulvinar etiam.
- Etiam vel felis lorem.
- Felis enim et feugiat.
Icons
Actions
Table
Default
| Name |
Description |
Price |
| Item One |
Ante turpis integer aliquet porttitor. |
29.99 |
| Item Two |
Vis ac commodo adipiscing arcu aliquet. |
19.99 |
| Item Three |
Morbi faucibus arcu accumsan lorem. |
29.99 |
| Item Four |
Vitae integer tempus condimentum. |
19.99 |
| Item Five |
Ante turpis integer aliquet porttitor. |
29.99 |
|
100.00 |
Alternate
| Name |
Description |
Price |
| Item One |
Ante turpis integer aliquet porttitor. |
29.99 |
| Item Two |
Vis ac commodo adipiscing arcu aliquet. |
19.99 |
| Item Three |
Morbi faucibus arcu accumsan lorem. |
29.99 |
| Item Four |
Vitae integer tempus condimentum. |
19.99 |
| Item Five |
Ante turpis integer aliquet porttitor. |
29.99 |
|
100.00 |