Introduction
In a world where sustainability is becoming a core business driver, companies need tools that go beyond just compliance—they need insights. I built this tool to help businesses visualize their environmental impact, monitor carbon emissions and identify areas for improvement using real-time, data-backed analysis.
Objective
- Build a scalable tool to track and analyze sustainability metrics.
- Provide real-time insights into emissions, energy, and waste.
- Help leadership make eco-conscious, data-driven decisions.
- Automate reporting and reduce manual effort.
- Benchmark performance over time and against industry standards.
Methodology
Data Handling:
- Cleaned and preprocessed 10M+ rows using Pandas, handling missing values, removing duplicates and normalizing key features using Min-Max scaling for consistent comparisons.
- Handled datetime parsing and feature engineering to extract monthly/quarterly/yearly trends
- Merged multiple data sources (internal operations, utility usage, transportation logs) to create a unified sustainability dataset.
Analytics & Metrics:
- Created Custom KPIs (Calculated Fields) such as:
- Total Carbon Emissions (MT CO2)
- Total Carbon footprint (MT CO2)
- Energy Consumption (MWh)
- Emissions per distance (kg CO2/km)
- Sustainability Score
- Performed YoY and MoM comparisons using calculated columns and window functions.
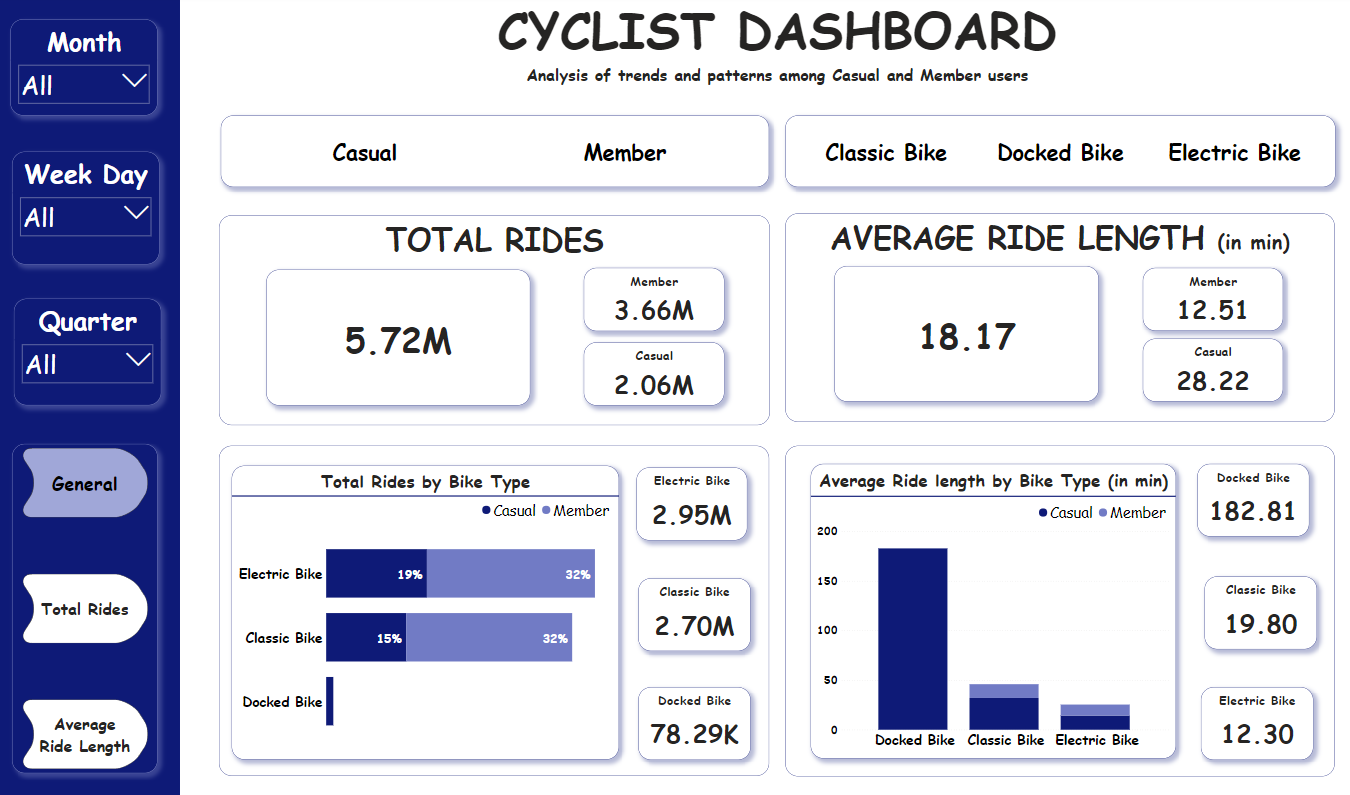
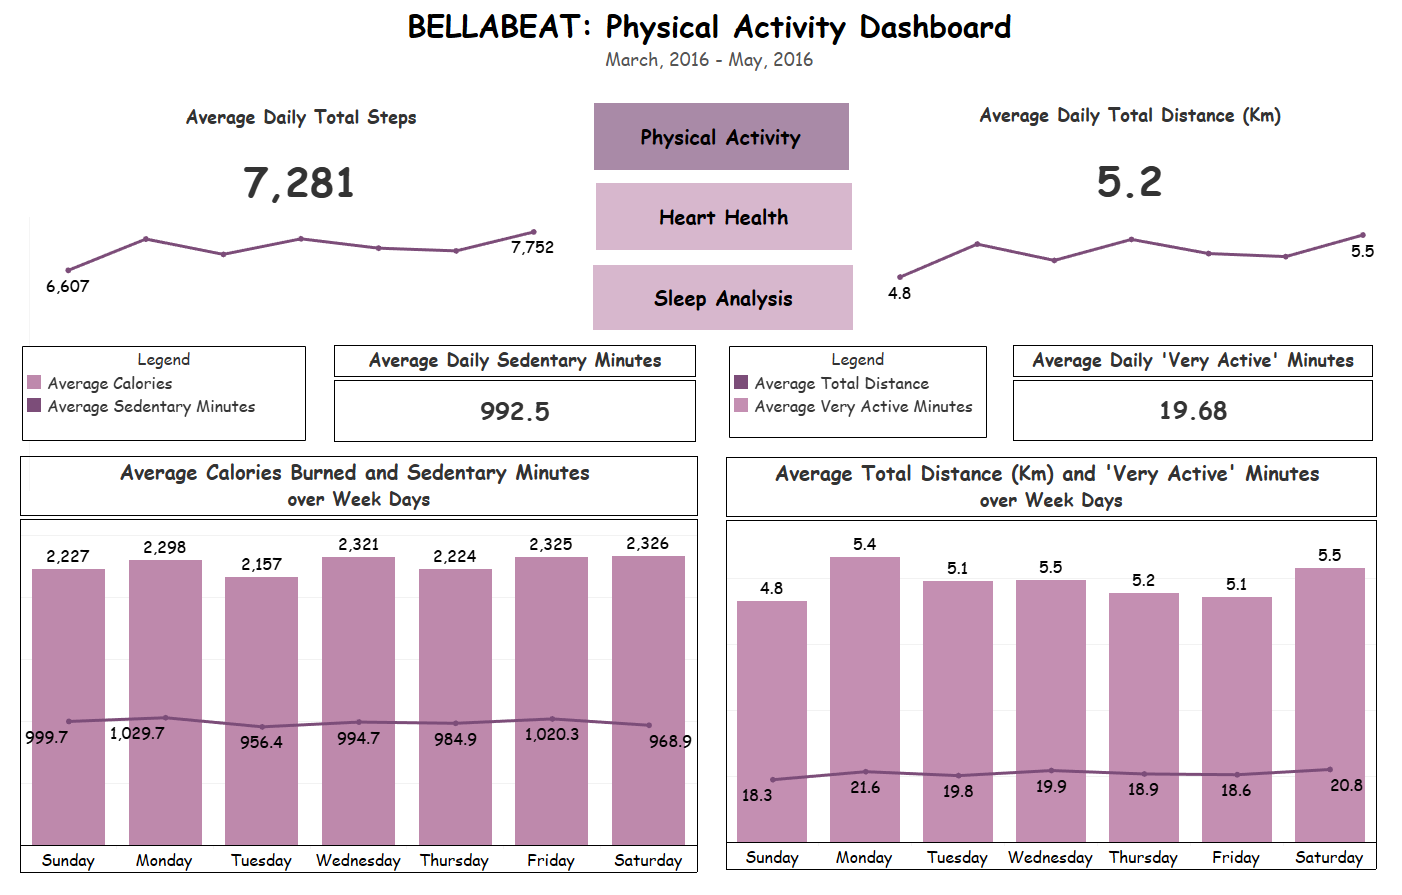
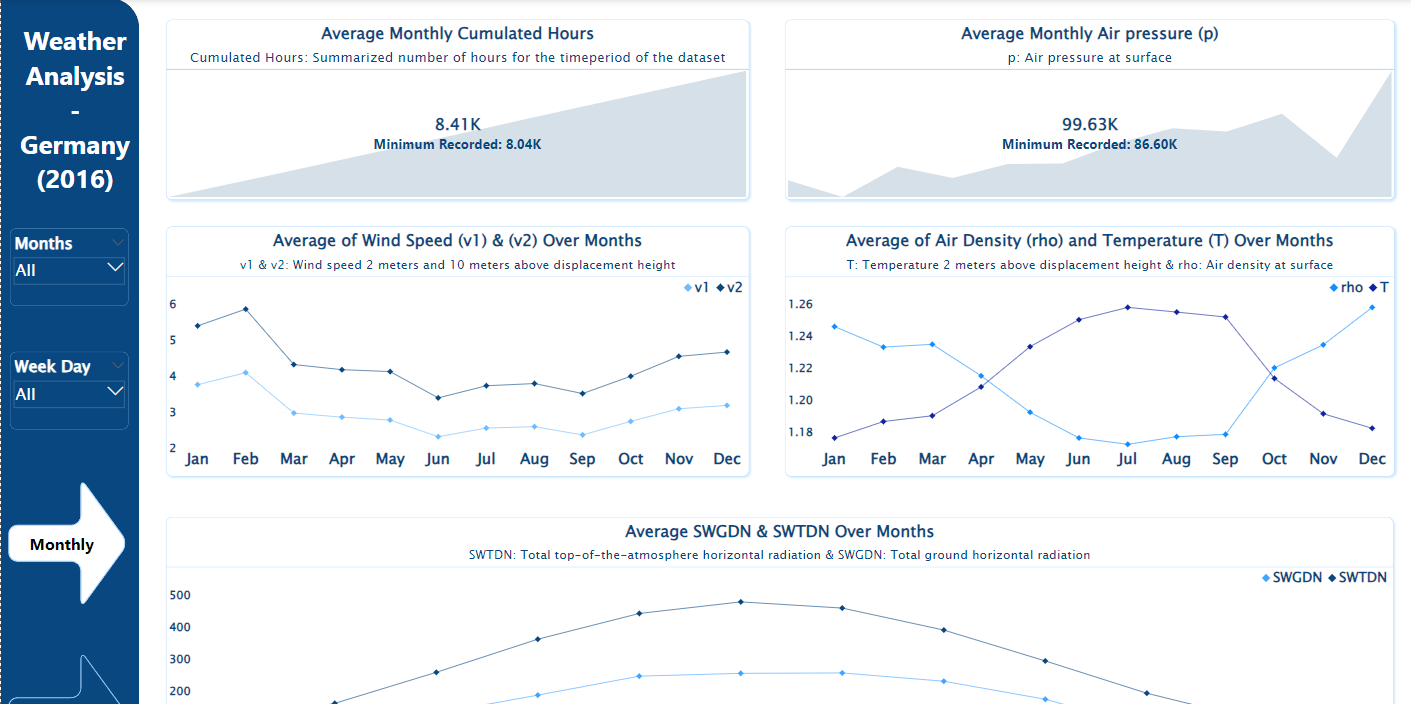
Dashboard & Visualization (Tableau):
- Built interactive dashboards with dynamic filters (region, department, time range)
- Included line charts for trends, gauge charts for sustainability scores, and heatmaps to identify high-emission zones.
- Designed a scorecard view that highlighted top performers and red flags.
Automation & Reporting:
- Used Python scripts with Scheduled Tasks to automate monthly data refresh and dashboard updates.
- Enabled export to PDF and Excel options with one-click snapshots for leadership reporting.
- Ensured compatibility with Tableau Public and Tableau Server for flexible sharing.
Result
- Reduced manual reporting time by 10–12 hours per month through automation.
- Empowered the sustainability team with a real-time view of emissions, leading to quicker interventions and better decision-making.
- The company used the tool to identify areas of improvement, resulting in a significant reduction in carbon emissions.
Summary
- Tools Python & Tableau
- Objective To create a sustainable optimizer tool.
Mockup Dashboard is coming soon....