Introduction:
This project focuses on analyzing Airbnb data using Microsoft Excel, leveraging Power Query for data manipulation and Pivot Tables for insights generation. The dataset comprises information about Airbnb listings, including room types, prices, availability, and licensing status. The objective is to extract meaningful insights to understand listing trends and user preferences in the Airbnb marketplace.
Data Preparation:
- Data Loading:
The dataset is loaded into Power Query for further analysis.
- Data Type Adjustment:
Data types are modified to ensure consistency and accuracy in subsequent analyses.
- Column Removal:
The "neighbourhood" column, containing only null values, is removed to streamline the dataset.
- Price Formatting:
The price column is formatted as currency to enhance readability.
- Date Extraction:
Year and month are extracted from the "last review date" column to facilitate temporal analysis.
Pivot Tables:
Pivot tables are created to summarize and visualize key insights:
- Room Type vs. Average Prices:
Provides insights into pricing trends across different room types.
- Total Number of Room Types:
Indicates the distribution of room types in the Airbnb listings.
- Average Minimum Nights Spent:
Highlights the average duration of stay for each room type.
- Average Availability for 365 Days:
Shows the availability of listings throughout the year by room type.
- Count of Licenses by Room Type:
Displays the distribution of licensed listings across different room types.
Measures/KPIs:
- Total Airbnb Listed: Counts the total number of Airbnb listings.
- Total % of Different Room Types Listed: Calculates the percentage distribution of room types.
- Total Licensed Airbnb: Counts the total number of licensed Airbnb listings.
- Total % of Different Licensed Room Types: Calculates the percentage distribution of licensed room types.
Pivot Charts:
Pivot charts are generated to visually represent key findings from pivot tables:
- Average Prices for Room Type: Illustrates pricing variations across different room types.
- Average Minimum Nights Spent by Room Type: Visualizes the average duration of stay for each room type.
- Average Availability for 365 Days by Room Type: Displays the availability of listings throughout the year by room type.
Results:
- License Distribution:
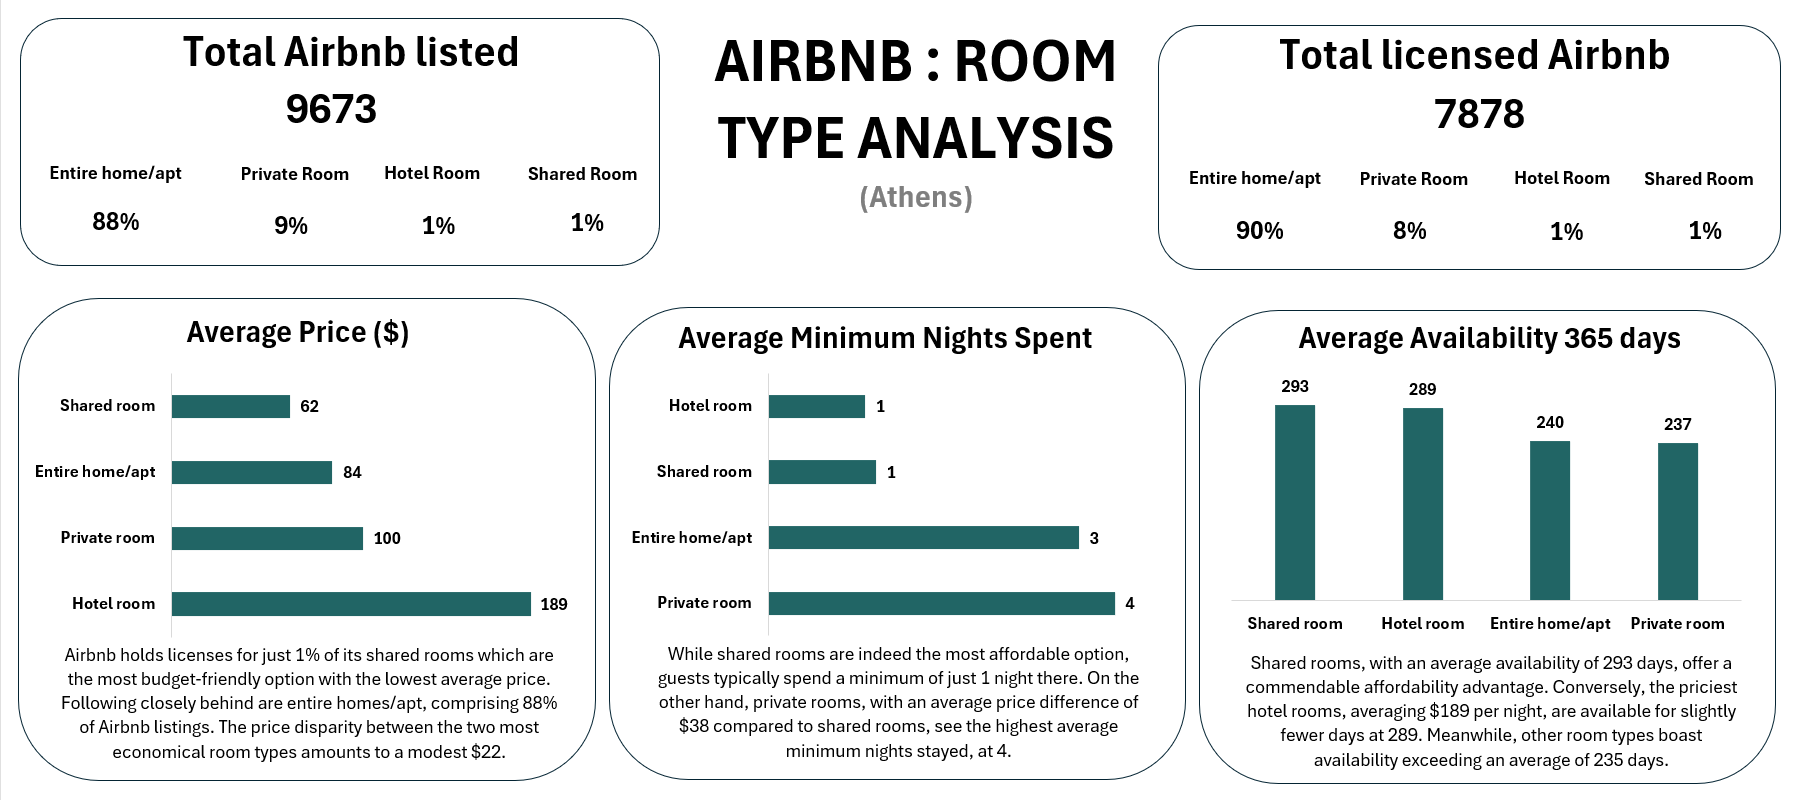
Only 1% of Airbnb shared rooms are licensed, representing the most budget-friendly option with a modest price difference of $22 compared to entire homes/apartments, which comprise 88% of listings.
- Minimum Nights Spent:
Private rooms, with an average price difference of $38 compared to shared rooms, see the highest average minimum nights stayed, at 4.
- Availability Trends:
Shared rooms offer commendable affordability with an average availability of 293 days, while other room types boast availability exceeding 235 days.
- Tools Excel
- Stages Data Preparation Pivot Tables Measure / KPIs Pivot Charts
- Go to Github!