Objective
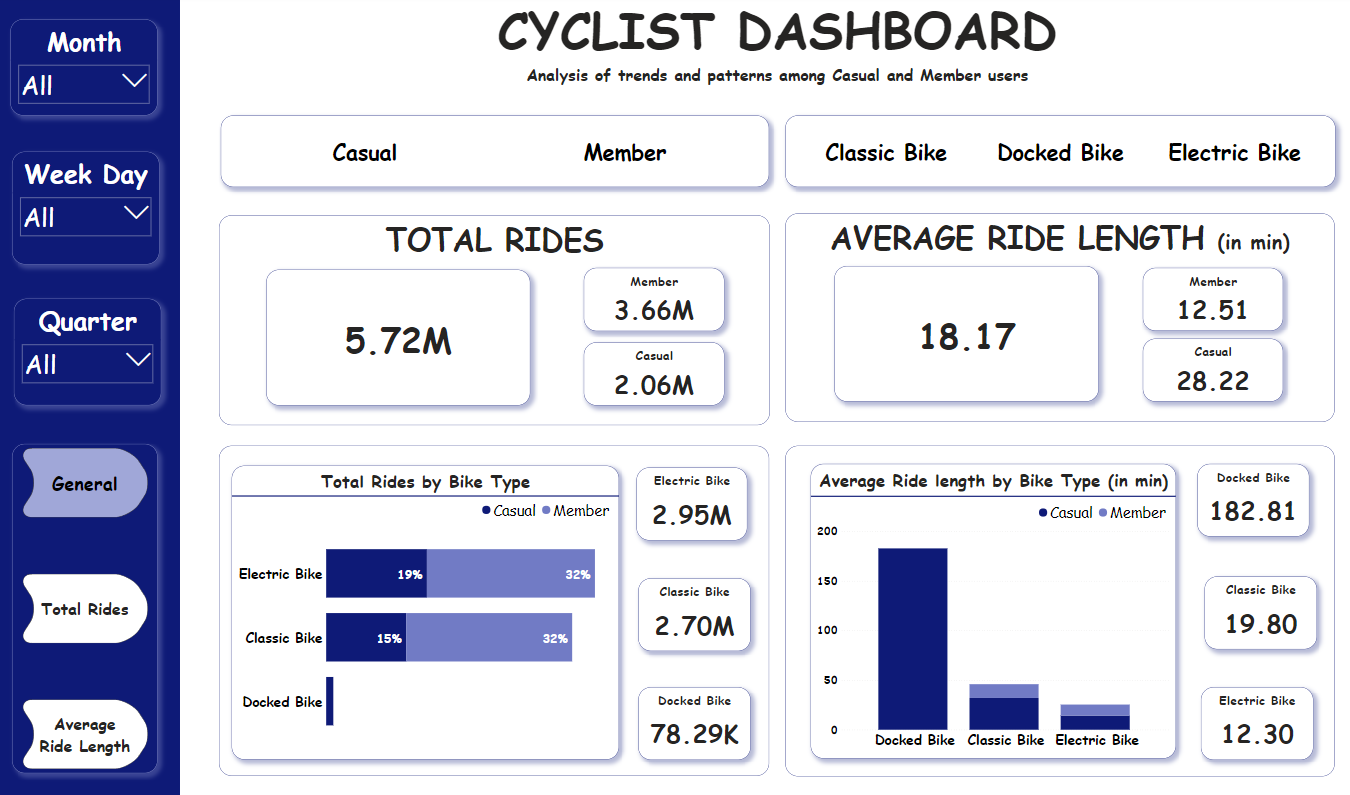
The aim is to develop a comprehensive dashboard presenting insightful data on the usage patterns of casual and member users of bike rides. This dashboard will offer a clear overview of total rides and ride lengths across different timeframes, including months, days, and quarters.
Methodology
-
Data Transformation:
The project begins with data acquisition and transformation. Cleaned and Merged data is imported into Power BI and transformed to ensure consistency and usability.
Column values are standardized by replacing values such as "classic_bike" with "Classic Bike" using the "Replace Values" transformation feature.
Additional columns are created to extract meaningful information, including month names, month numbers, quarters, and weekday numbers. This ensures proper ordering of months and weekdays for visualization purposes.
-
Data Modeling and Measures:
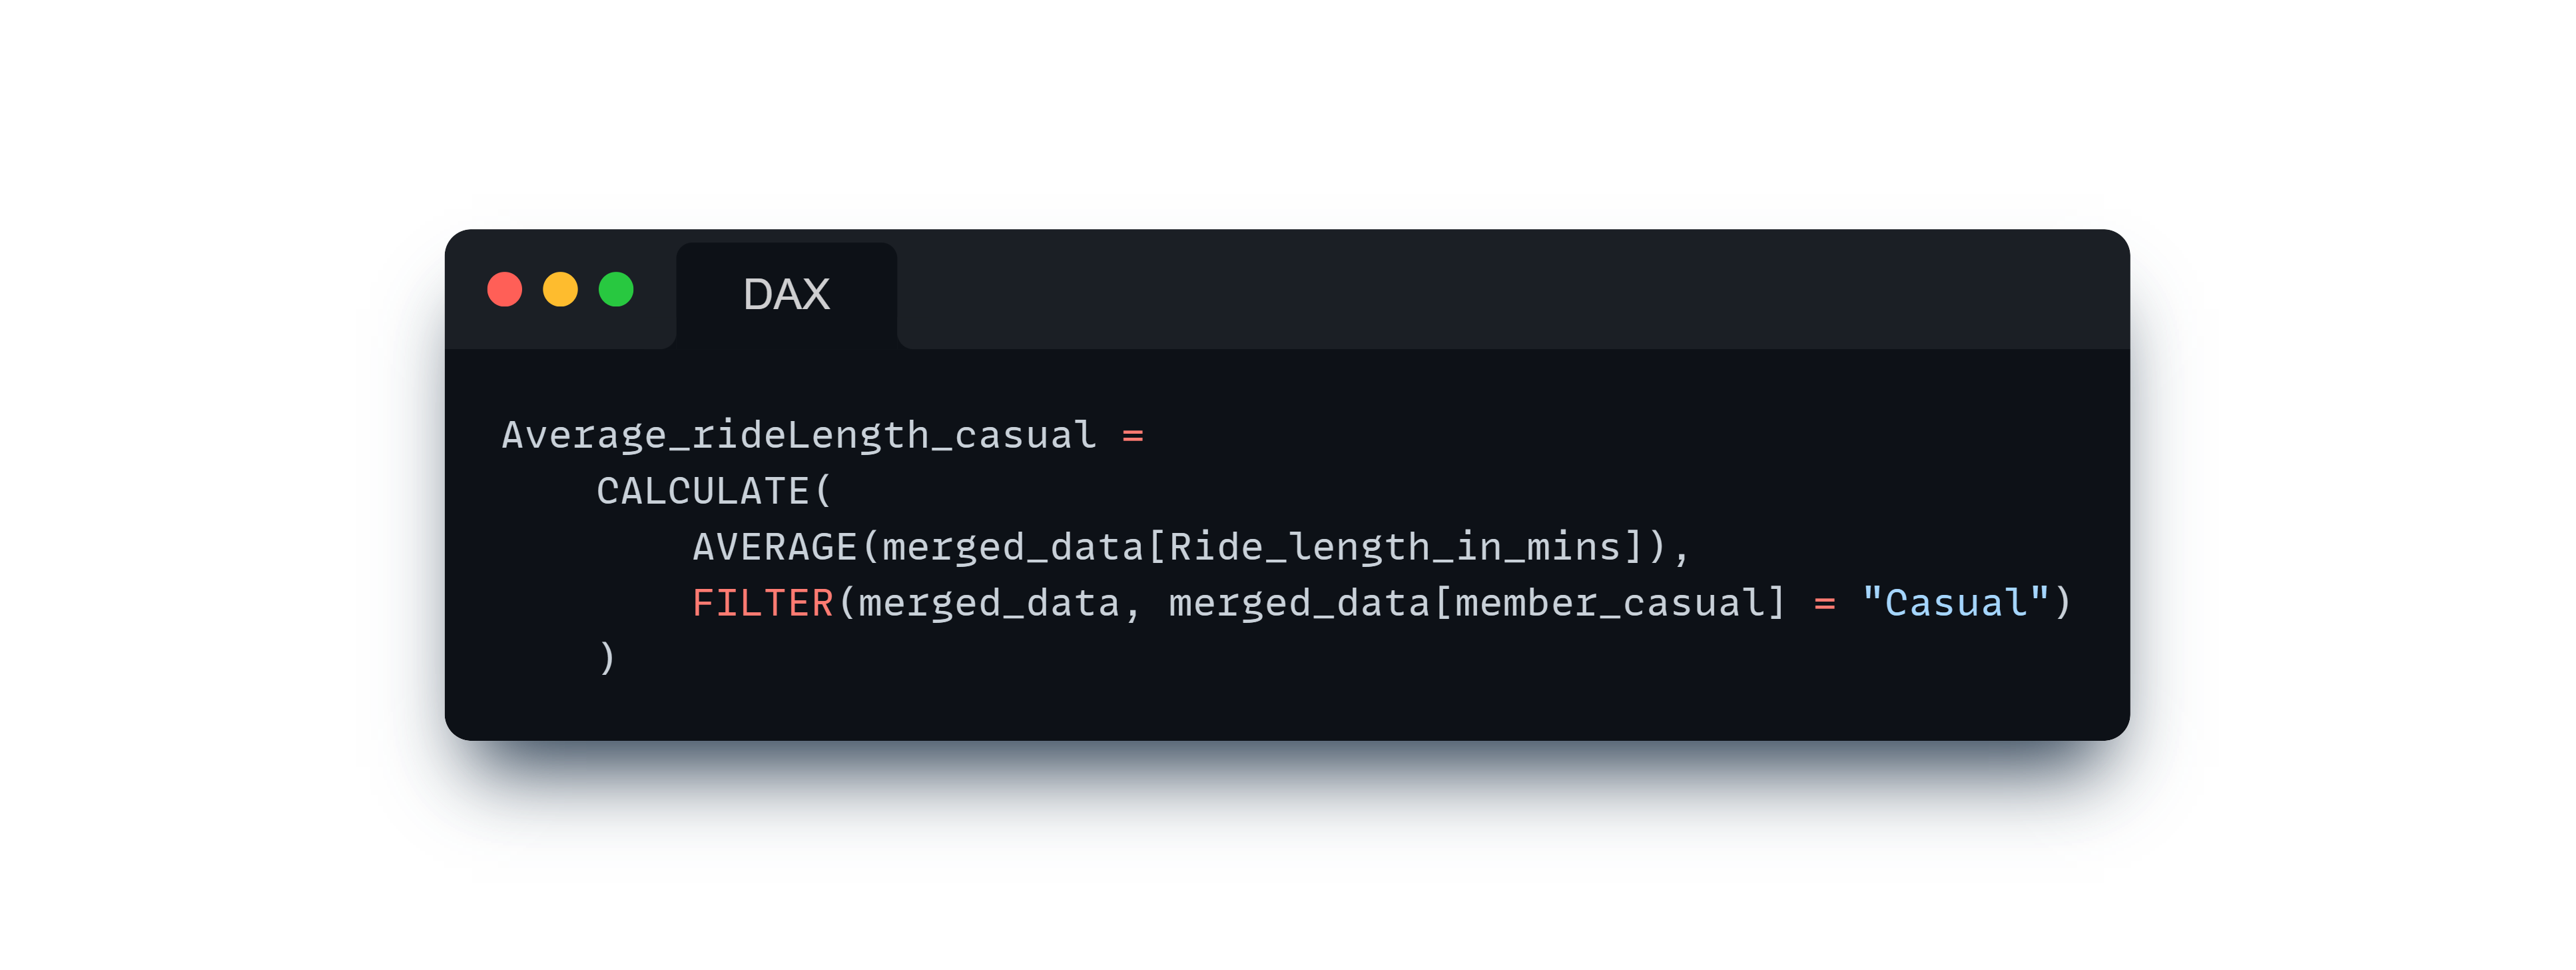
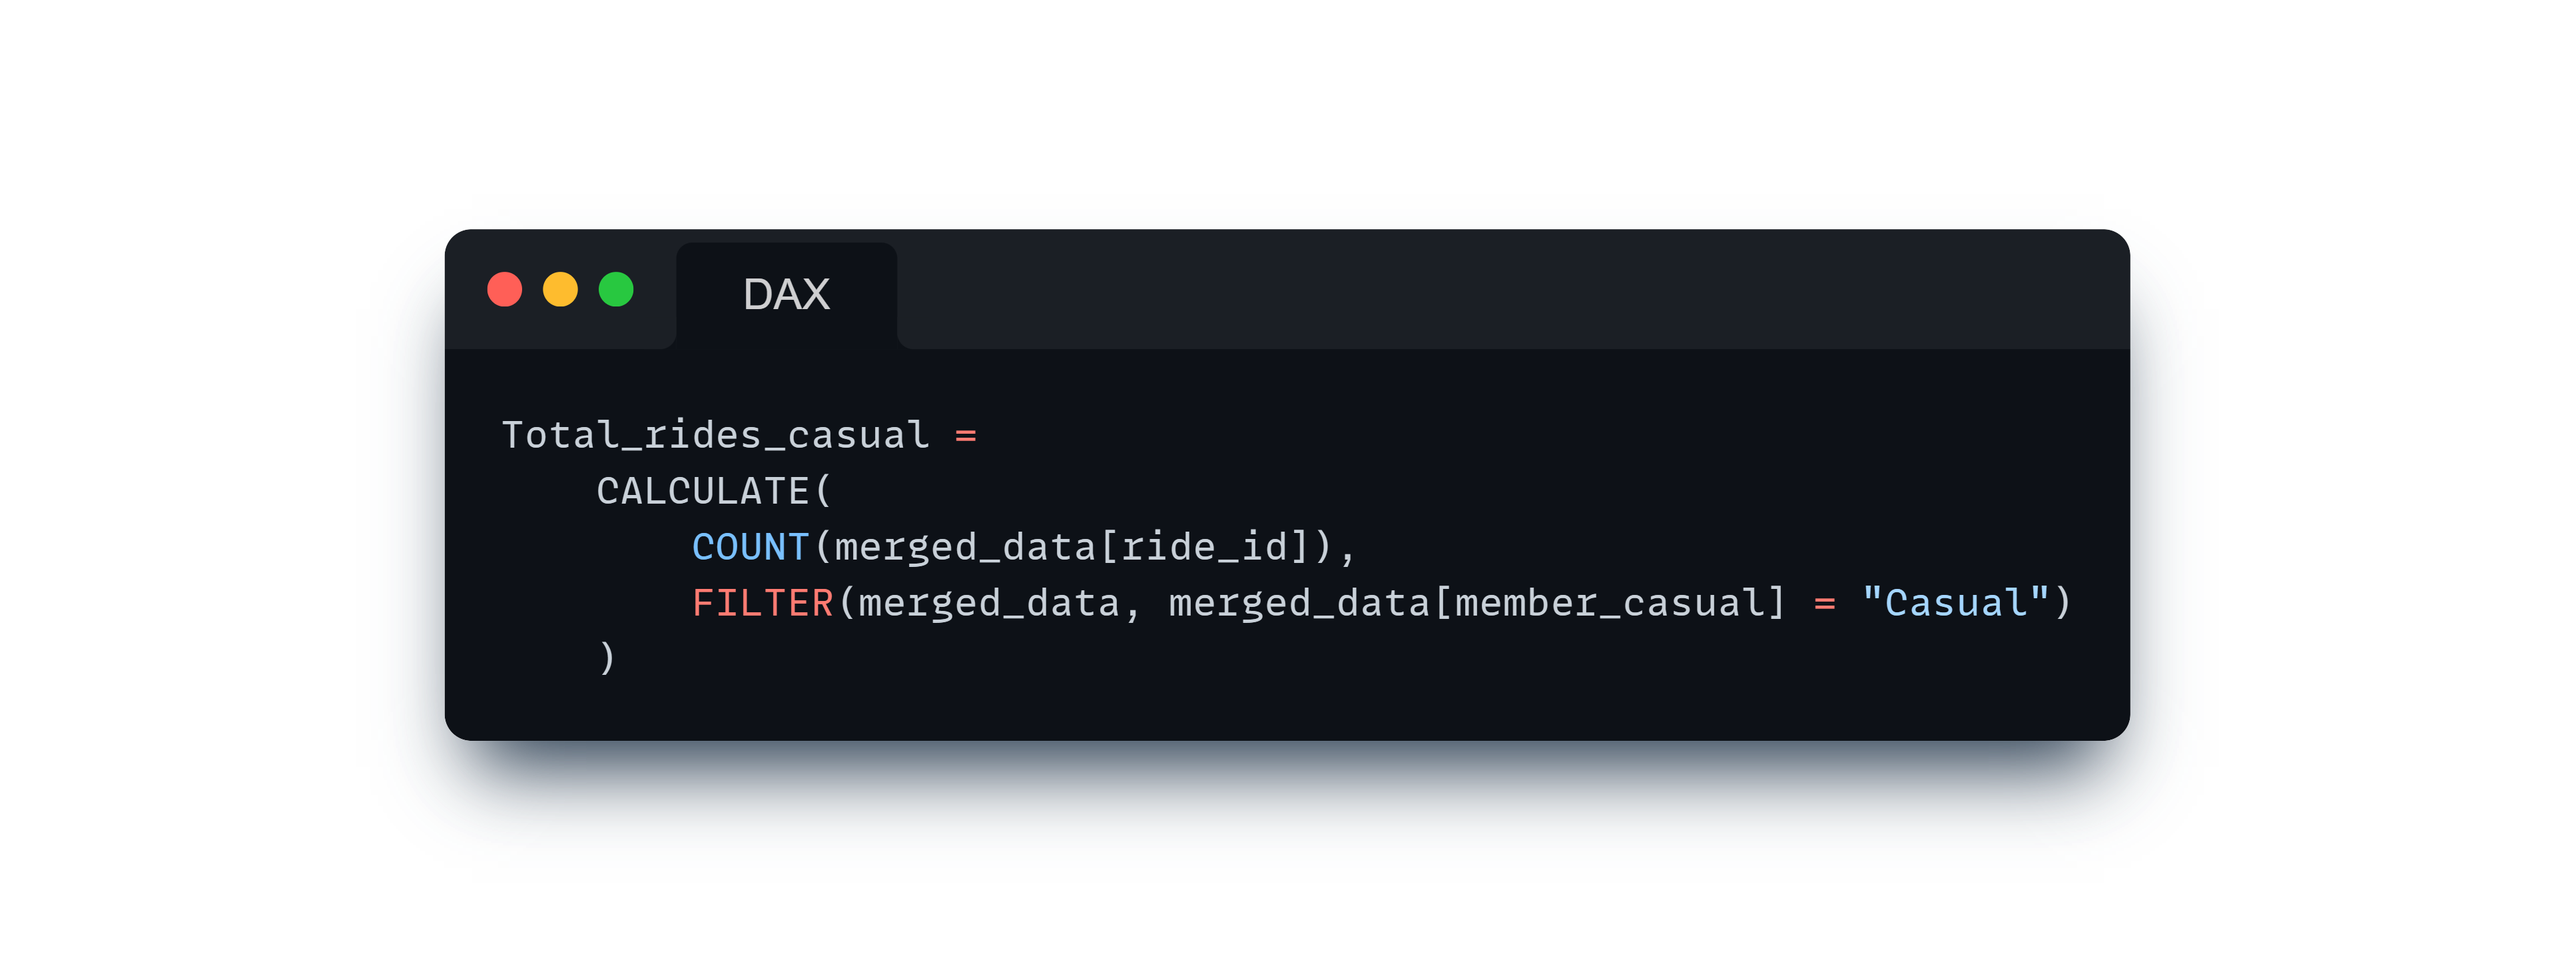
Key performance indicators (KPIs) are defined, such as total monthly rides and average monthly ride length.
Measures are created using Data Analysis Expressions (DAX) to calculate metrics such as average ride length and total rides for different user types and bike categories.
-
Visualization Creation:
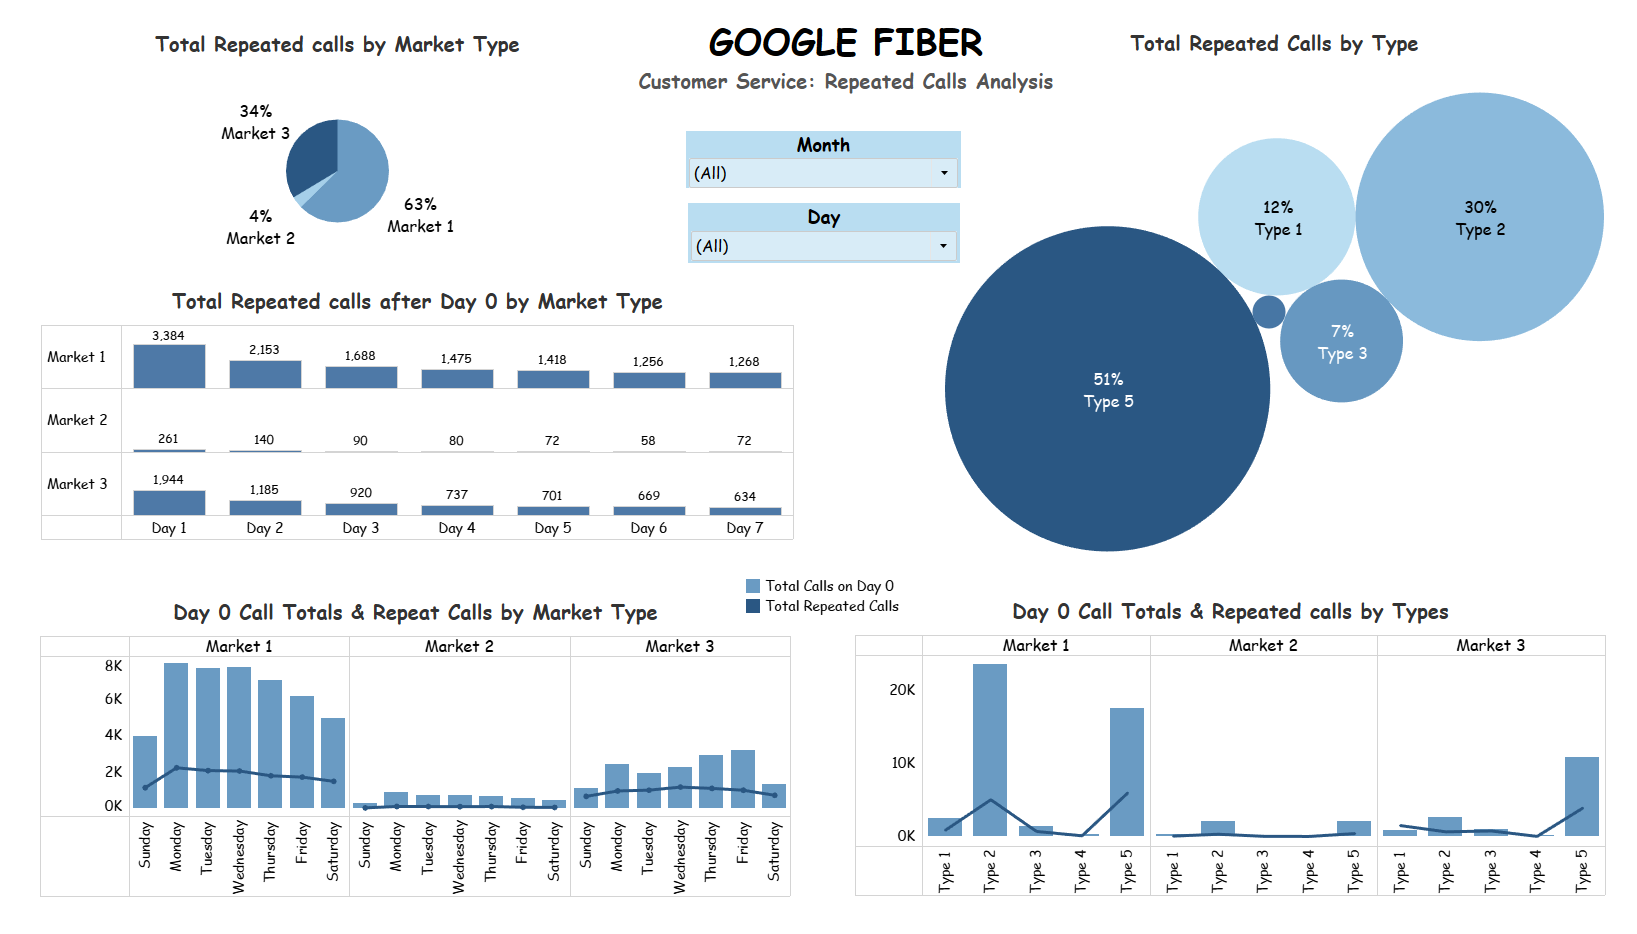
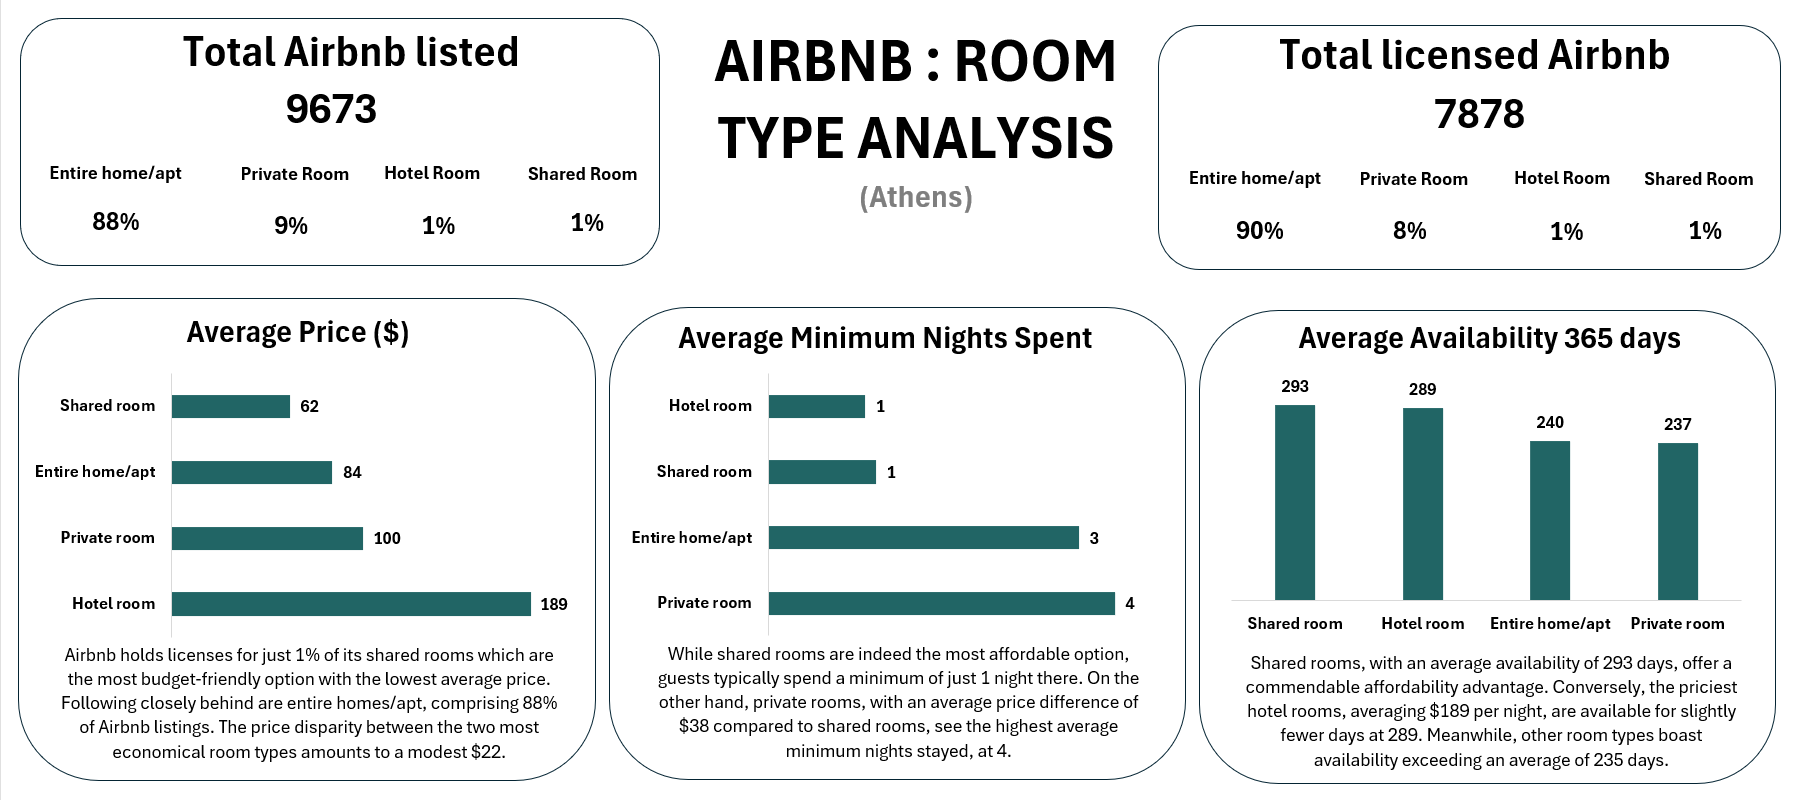
Various visualizations are developed to provide insights into bike-share usage patterns.
Clustered bar charts depict total rides by bike type, while clustered column charts showcase average ride length by bike type.
Line charts visualize trends in total quarterly rides, total daily rides, quarterly average ride length, and daily average ride length.
-
Dashboard Development:
Three distinct dashboards are created: a general overview, total rides analysis, and average ride length analysis.
Each dashboard offers specific insights and facilitates easy navigation between different sections, enhancing user experience and understanding.
-
Interactivity and Navigation:
Navigation buttons are integrated to enable seamless navigation between dashboards, allowing users to explore various analyses and insights effortlessly.
Summary
- Tools Power BI
- Stages Data Transformation Data Modeling and Measures Visualization Creation Dashboard Development Navigation
- Go to Github!
- Go to Dashboard!