Introduction
This project dives deep into Bellabeat fitness tracker data using both Python and Tableau. Our main goal is to uncover important insights about how users behave, their activity levels, heart health, and sleep habits. By doing this, we hope to improve the product and give users better tools to track their health.
Objective
- Clean, manipulate, explore, and interpret Bellabeat fitness tracker data using Python.
- Create a comprehensive health analytics dashboard integrating Bellabeat fitness tracker data using Tableu
Methodology
- Data Cleaning and Transformation:
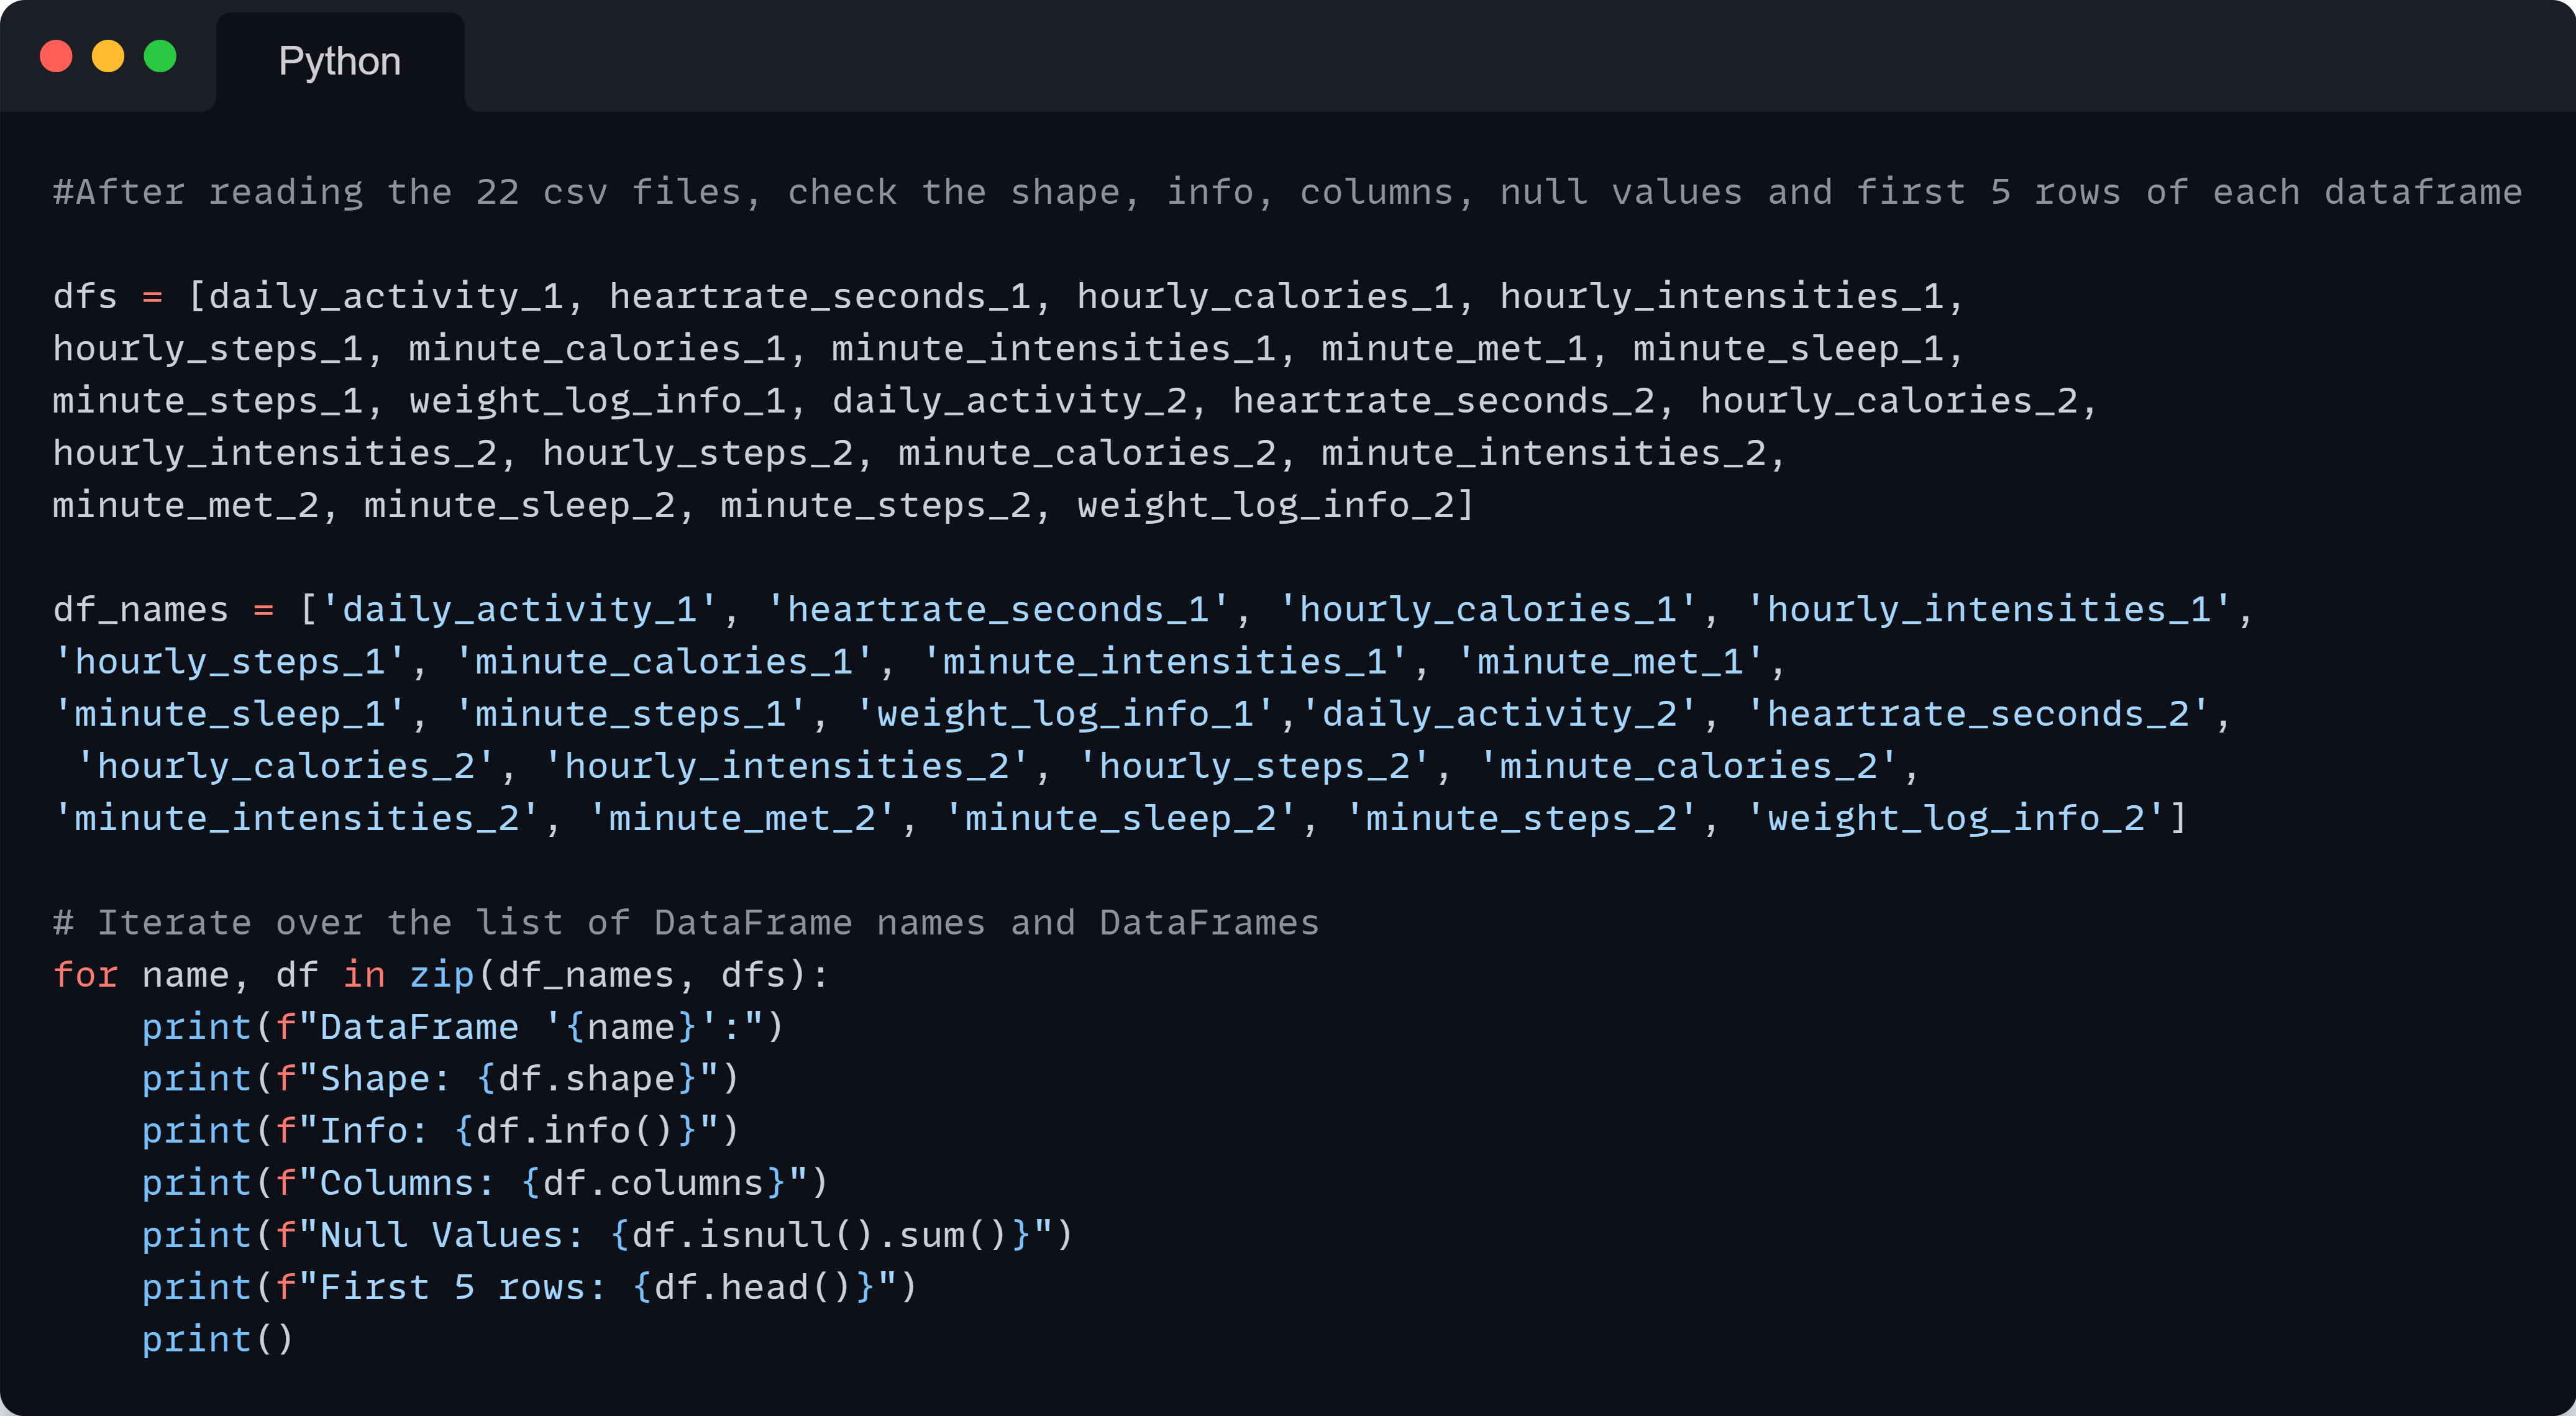
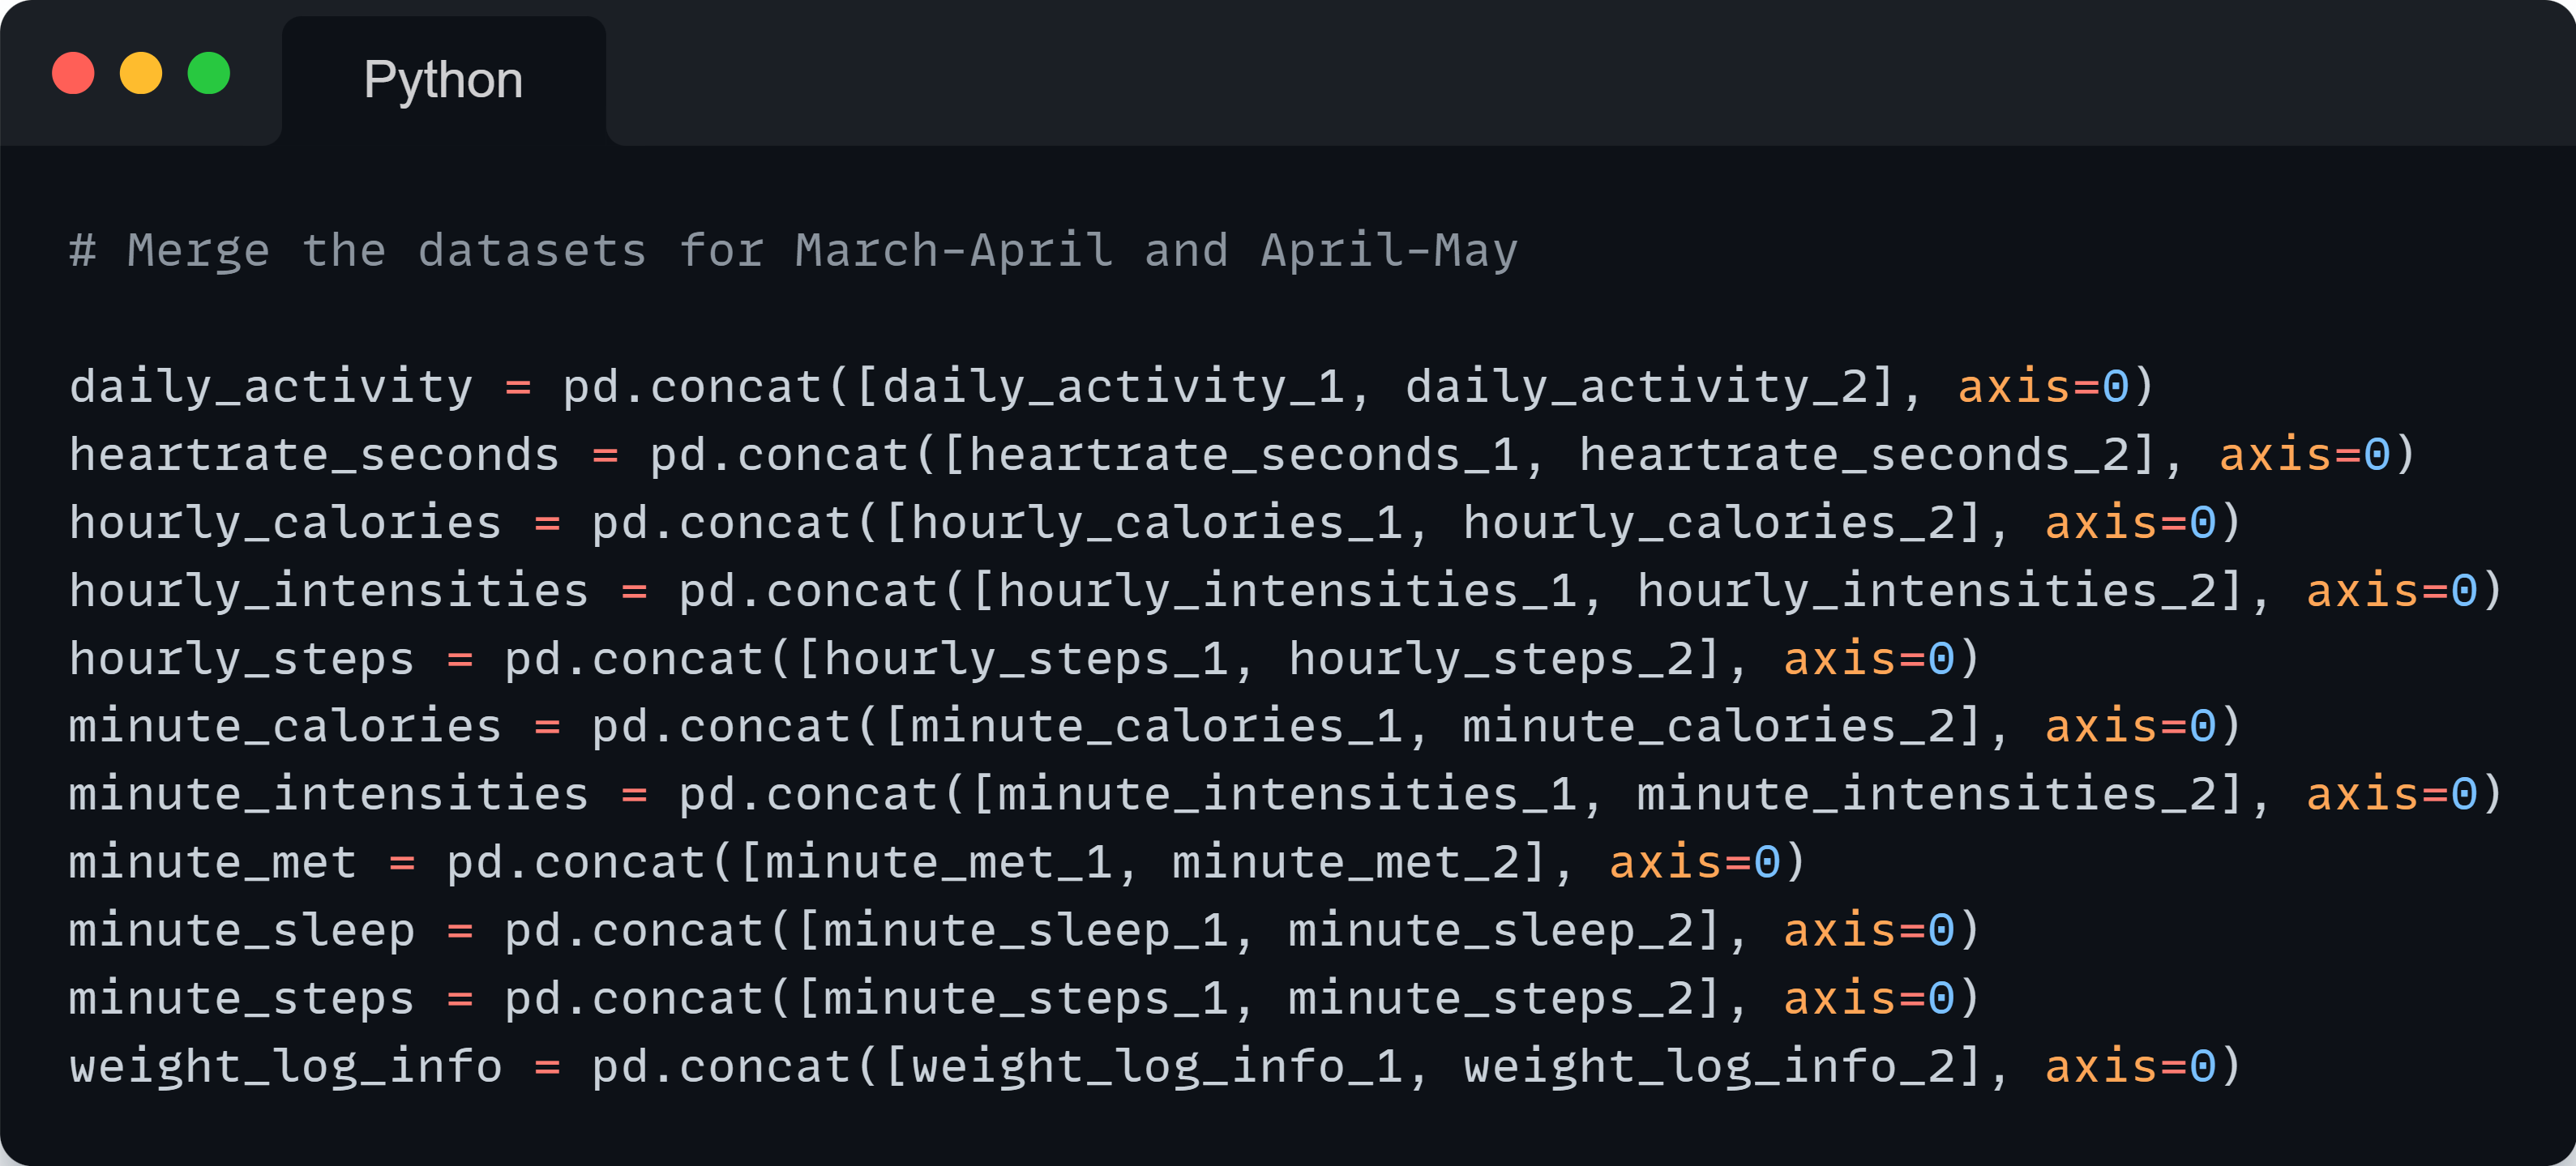
The initial phase involved loading 22 CSV files containing data for two time periods: March-April and April-May. Each dataset underwent cleaning and transformation to ensure consistency and prepare them for analysis. This process included importing necessary libraries, handling data types, addressing missing values, and merging datasets for comprehensive analysis.
- Statistical Summary:
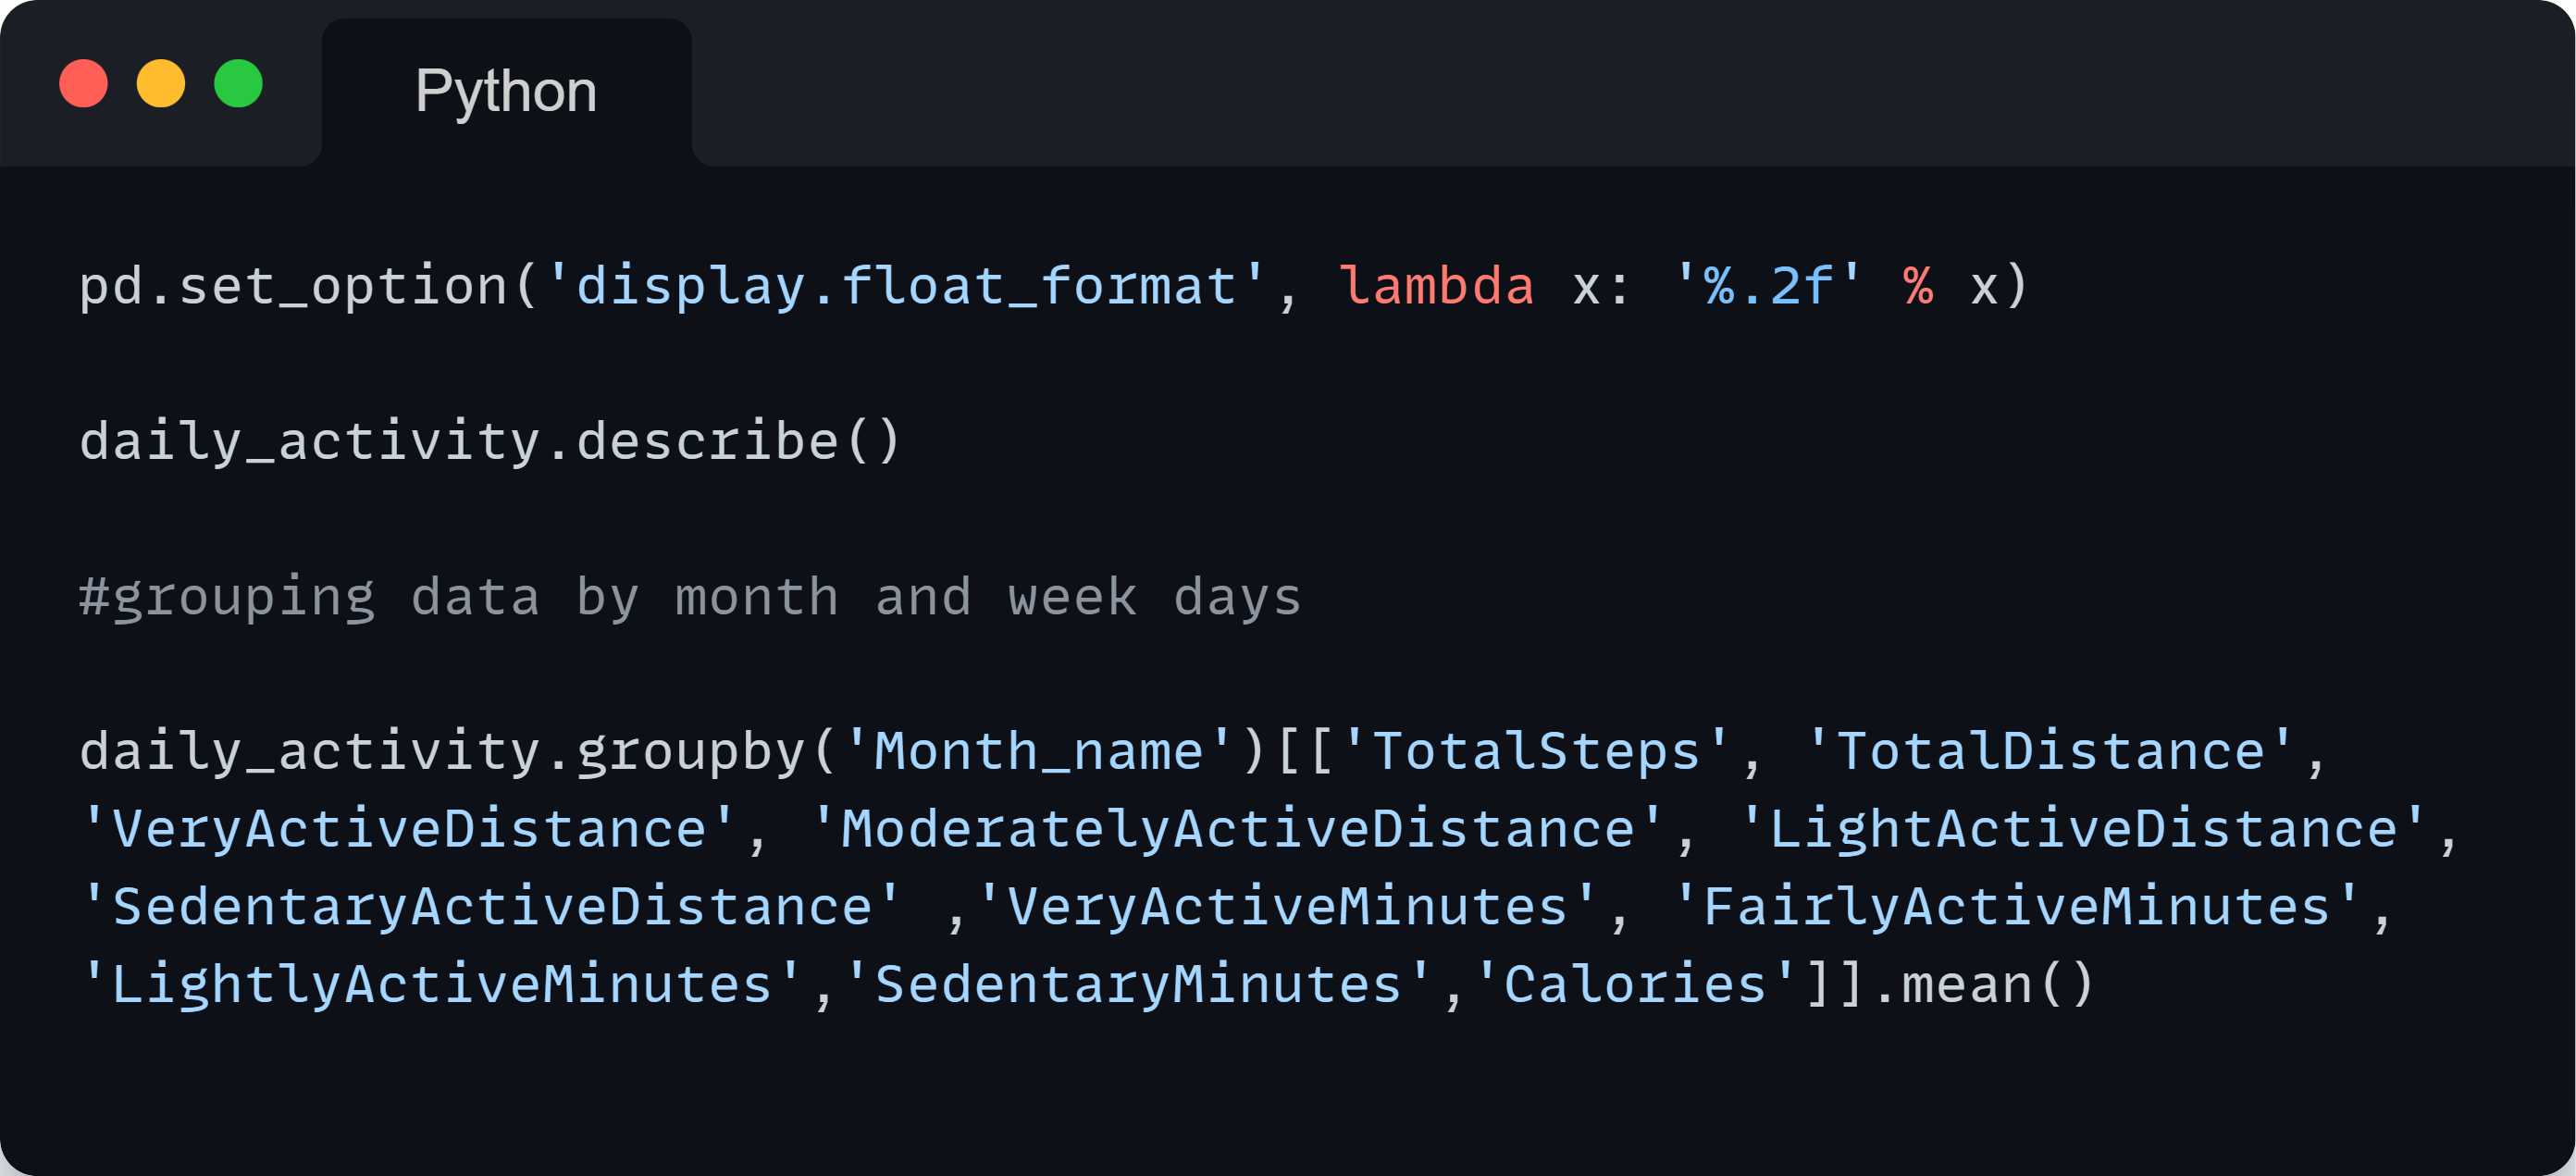
Statistical summaries were generated for key datasets, providing insights into the central tendency and dispersion of variables. These summaries aided in understanding the overall distribution of data and identifying potential outliers.
- Data Exploration and Visualization:
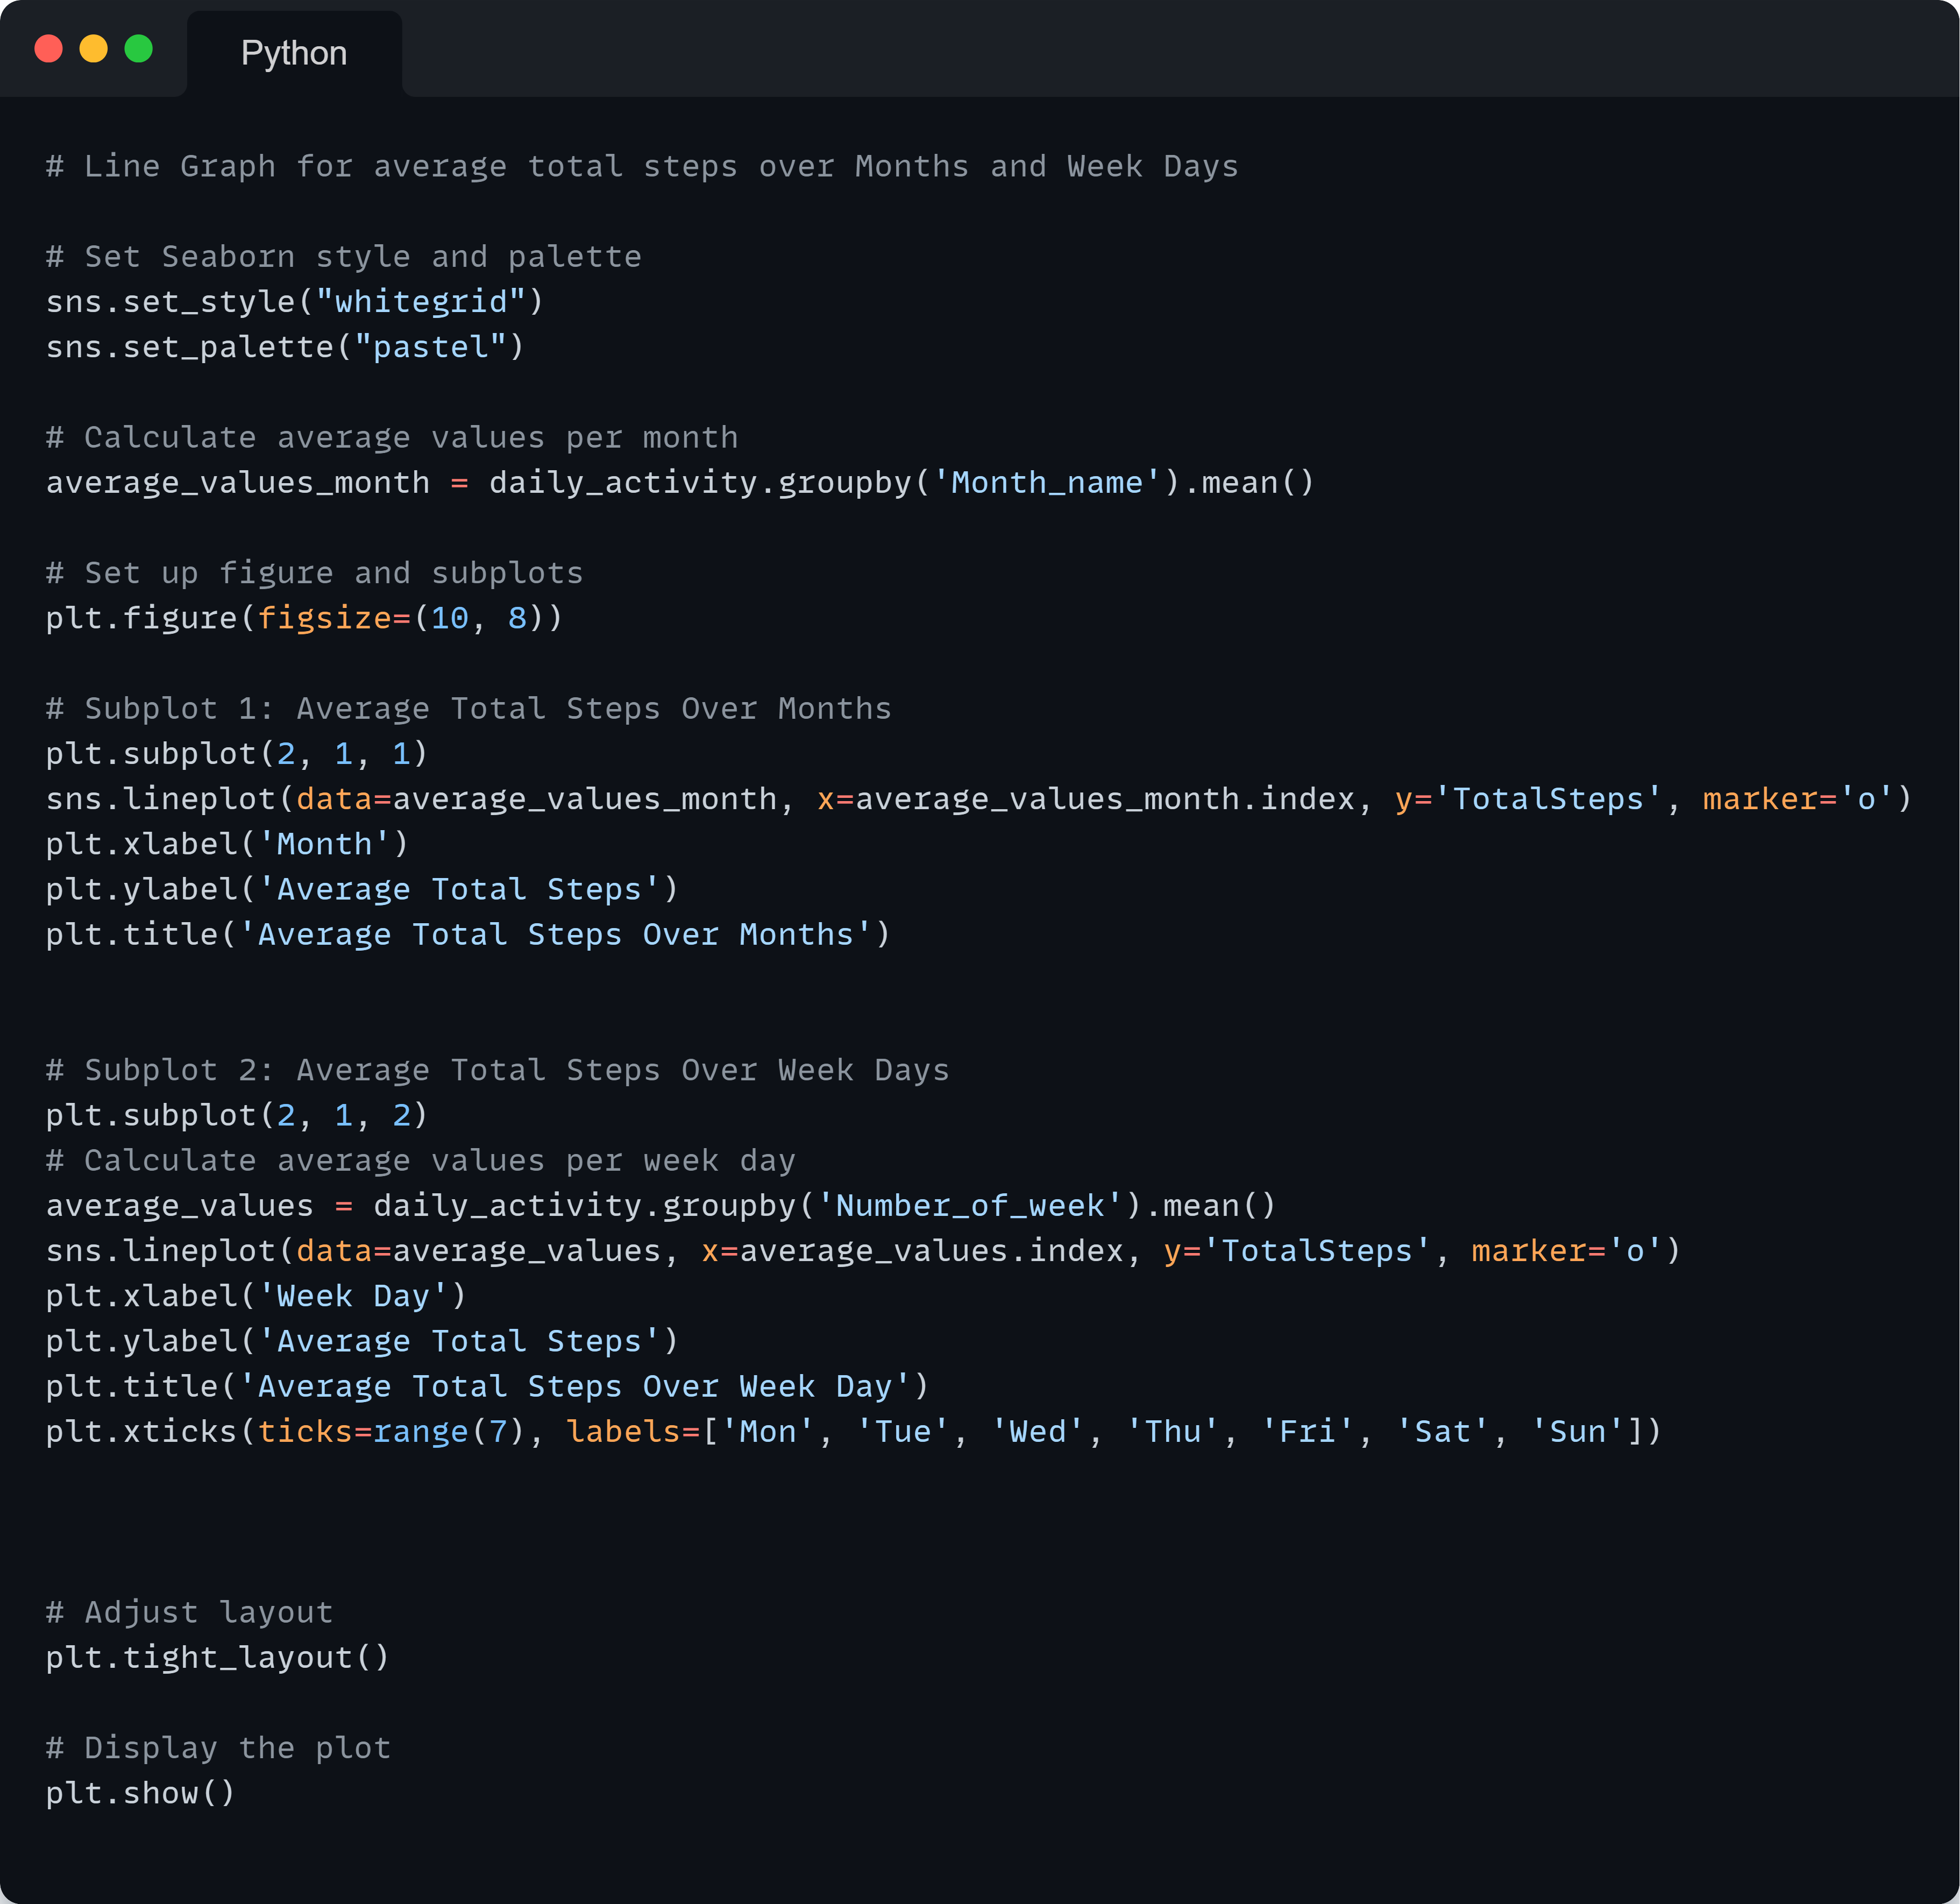
Exploratory data analysis (EDA) was conducted to uncover patterns, trends, and relationships within the data. Visualization techniques such as line graphs and heatmaps were employed to illustrate these findings. Notable analyses include daily activity trends, heart rate patterns, hourly data exploration, and minute-level analysis of calorie expenditure and sleep patterns.

Data Preparation in TABLEAU:
- Import and Clean Data:
Six cleaned files obtained from Python analysis is imported into Tableau. These files include data on physical activity, heart rate, and sleep duration.
- Column Name Standardization:
Column names is standardized across files. For instance, in the 'heartrate_seconds' file, the column 'value' is renamed to 'heart_rate', and in the 'minute_sleep' file, 'Value' is renamed to 'SleepStages'.
- Creating Groups for Time of Day:
Define the groupings as follows:
- 6-12: Morning
- 13-16: Afternoon
- 17-20: Evening
- Rest: Night (This will include all remaining hours)
- Creating Groups for Sleep Stages:
In the Group dialog box, define the groupings as follows:
- 1: Awake
- 2: Light Sleep
- 3: Deep Sleep
- Creating Calculated Fields for Sleep Duration:
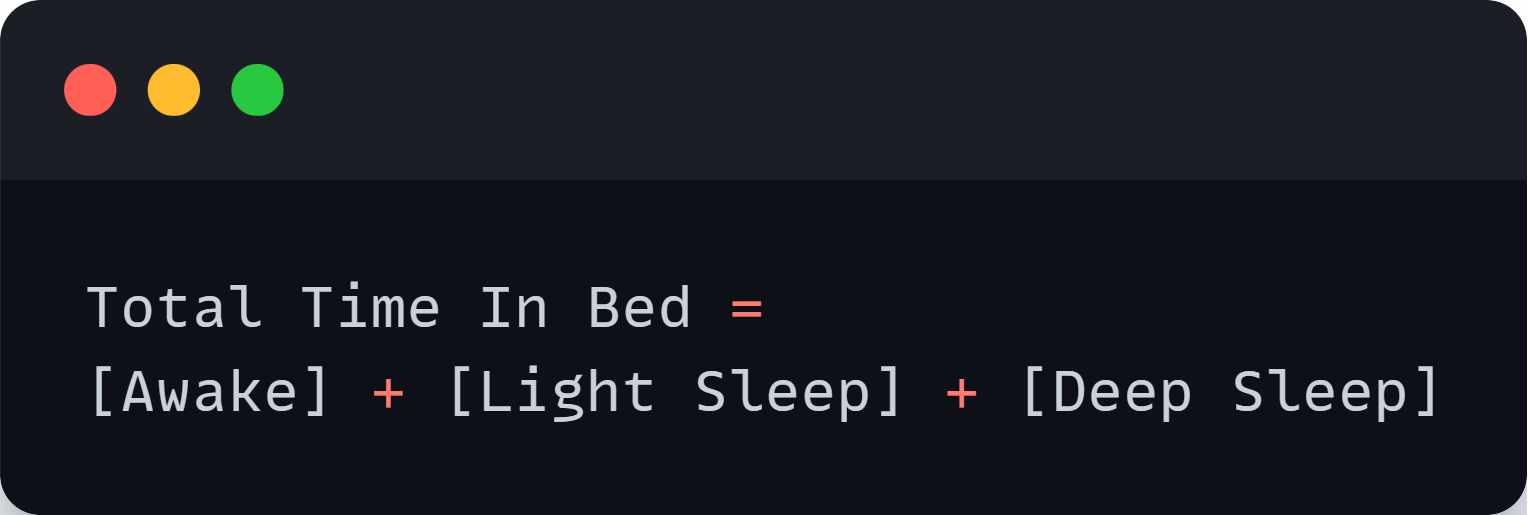
- Create Calculated Field - Total Time In Bed:
- Go to the 'Analysis' menu and select 'Create Calculated Field'.
- Name the calculated field 'Total Time In Bed'.
- Create Calculated Field - Total Sleep:

- Create Calculated Field - Total Time In Bed:
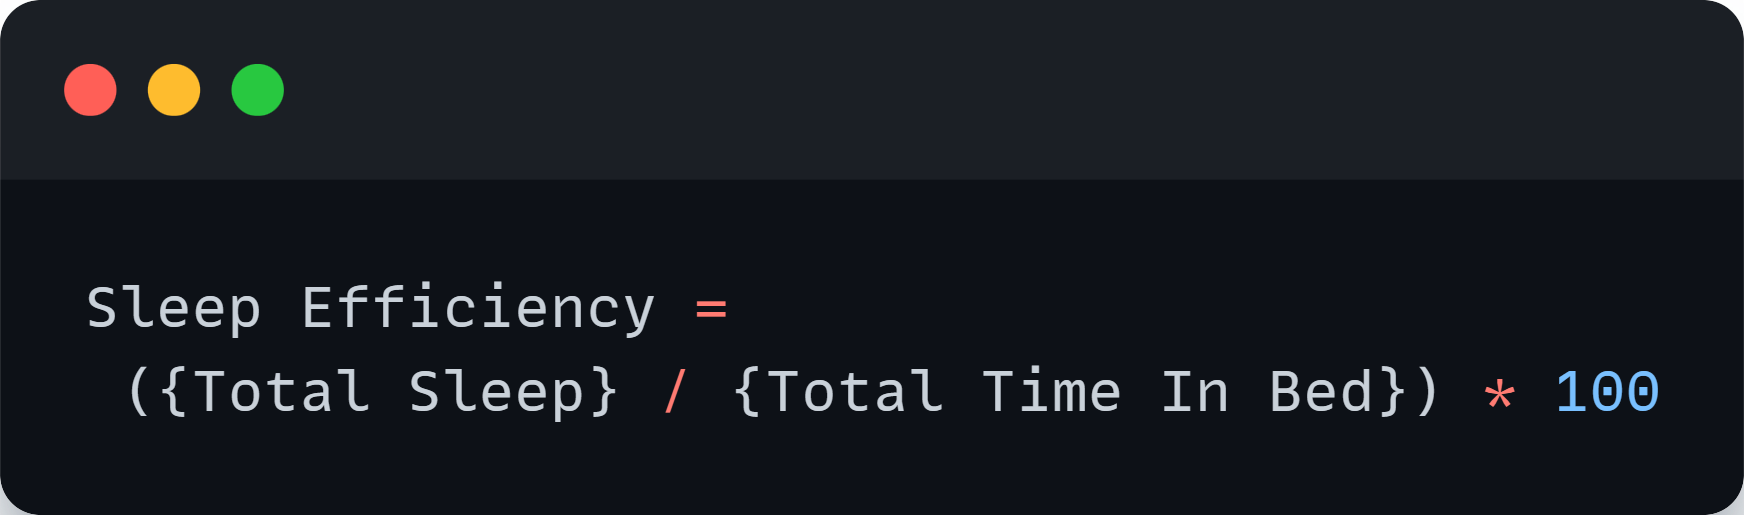
- Create Calculated Field - Sleep Efficiency:
- Import and Clean Data:
Data Visualization:
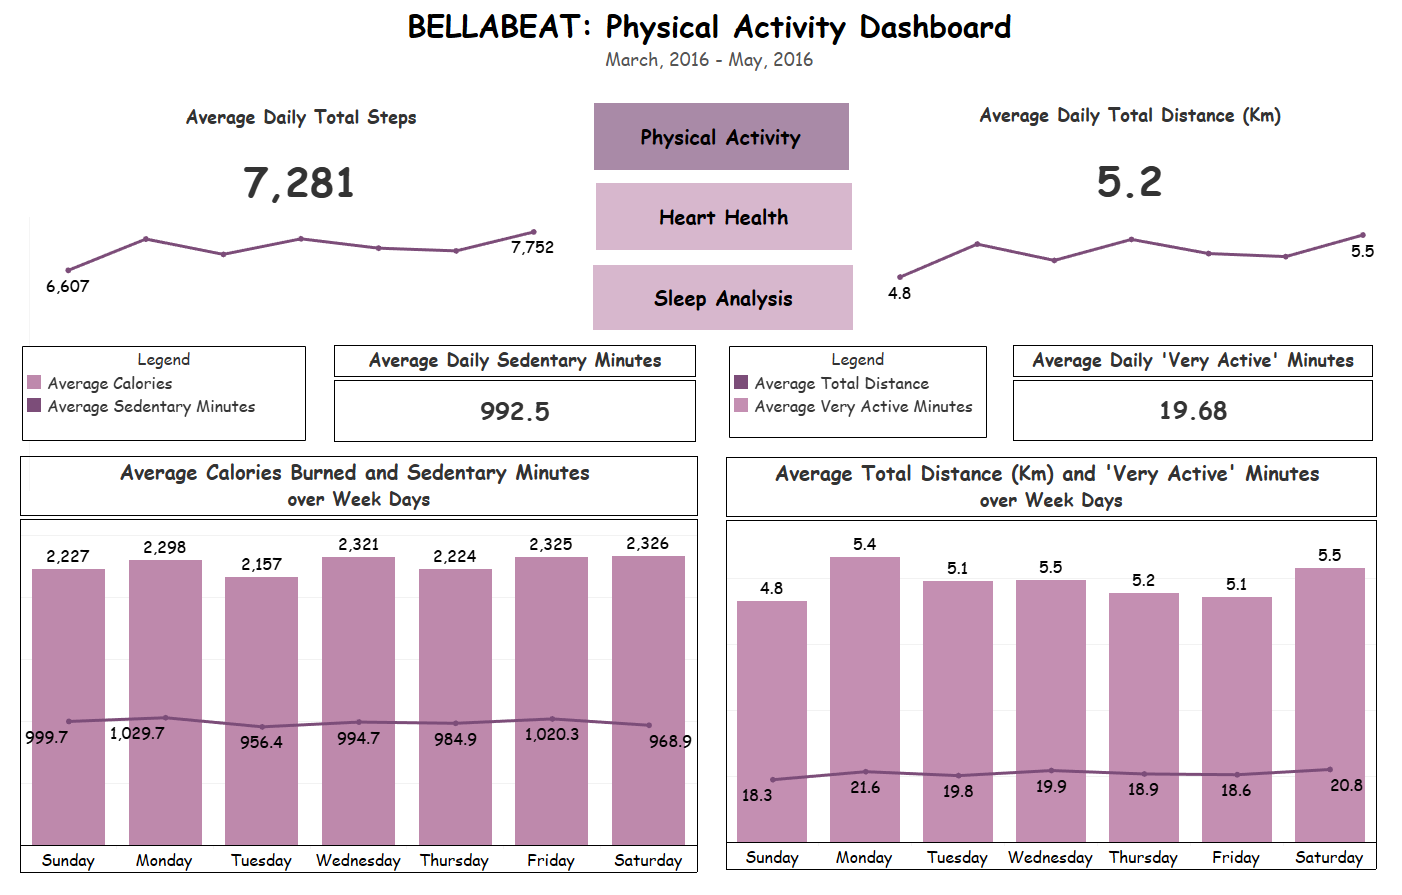
Physical Activity Dashboard:
- Key Performance Indicator (KPI) 1: Average daily steps is visualized using a card and a line chart.
- KPI 2: Average daily total distance is visualized using a card and a line chart.
- KPI 3: Average sedentary minutes is visualized using a card.
- KPI 4: Average "very active minutes" is visualized using a card.
- Dual Axis Chart: A dual-axis chart (column and line) is created to visualize the average calories burned and sedentary minutes over weekdays, as well as the average total distance and very active minutes over weekdays.
Heart Health Dashboard:
- KPI 1: Hourly average heart rate is visualized using a card and a line chart.
- KPI 2: Hourly average total steps is visualized using a card and a line chart.
- KPI 3: Hourly average total calories burned is visualized using a card.
- KPI 4: Hourly average of total intensity is visualized using a card.
- Dual Axis Chart: A dual-axis chart (column and line) is created to visualize the average heart rate and calories burned, as well as the average heart rate and total intensity.
Sleep Analysis Dashboard:
- KPI 1: Average sleep efficiency by hour is visualized using a card and a line chart.
- KPI 2: Average sleep efficiency by weekdays is visualized using a card and a line chart.
- Multiple Line Chart: A multiple line chart is created to analyze the pattern of hourly variation in sleep stages.
- Pie Chart: A pie chart is created to analyze the distribution of sleep stages.
Additional Features:
- All visuals are kept floating for flexible layout.
- Navigation buttons are inserted for seamless navigation between the three dashboards.
Results
Physical Activity:
- Average daily total steps: 7281, with Sunday having the lowest average (6607) and Saturday having the highest (7752).
- Average calories burned and sedentary minutes show consistent patterns across each day.
- Monday and Saturday recorded the highest total distance and average "very active" minutes.
Heart Health:
- Hourly average heart rate: 78.10
- Hourly average total steps: 302.5
- Afternoon has the highest average heart rate (75.2), while night has the lowest (64.7).
- Average total intensity is highest in the evening (16) and lowest at night (2.1).
Sleep Analysis:
- Average sleep efficiency by hour: Approximately 12 people have efficient sleep on average.
- Average sleep efficiency by weekdays: 8 people have efficient sleep on average.
- Distribution of sleep stages: 84% awake, 13% in light sleep, and 3% in deep sleep.
- Hourly variation in sleep stages: Most people are awake in the middle of the night, in light sleep in the early morning, and in deep sleep after 10 PM.
Summary
- Tools Python and Tableau
- Go to Github!
- Go to Github!