Objective
- Analyze repeated customer calls across different markets and types of issues to identify patterns, trends, and insights.
- Inform strategic decision-making for improving customer service and operational efficiency.
Tools and Skills
- Excel:
Data loading, data type manipulation, data extraction, data cleaning, and preparation.
- Power Query:
Data transformation including extracting month, week, quarter, and day, removing empty rows, and replacing null values.
- Tableau Public:
Data visualization, merging multiple Excel sheets, creating calculated fields, generating various types of charts (column charts, pie charts), applying filters, and formatting tooltips.
Methodology
Excel:
- Load Data in Power Query:
Import data from Excel files into Power Query for further processing.
- Data Type Transformation:
Change data types as necessary for columns such as 'date' to ensure consistency and accuracy in analysis.
- Extract Time Components:
Extract month, week, quarter, and day from the 'date' column to facilitate time-based analysis.
- Remove Empty Rows:
Eliminate rows with empty values in columns like 'market' and 'type' to enhance data quality.
- Replace Empty Values:
Replace null values with 0 in the 'contact_n_#' column to maintain data integrity.
- Repeat Data Cleaning:
Apply the same data cleaning steps to all files, ensuring consistency across datasets.
- Standardize Column Names:
Standardize column names such as changing "market_1" to "Market 1" for improved clarity and readability.
- Sheet Renaming:
Rename sheets to "Market_1," "Market_2," and "Market_3" for easy identification and organization.
- Save as Excel Workbook:
Save the cleaned and processed data as an Excel workbook for further analysis.
Tableau:
- Load Excel Workbook:
Import the cleaned Excel workbook into Tableau Public.
- Merge Excel Sheets:
Merge multiple Excel sheets using union to create a unified dataset for analysis.
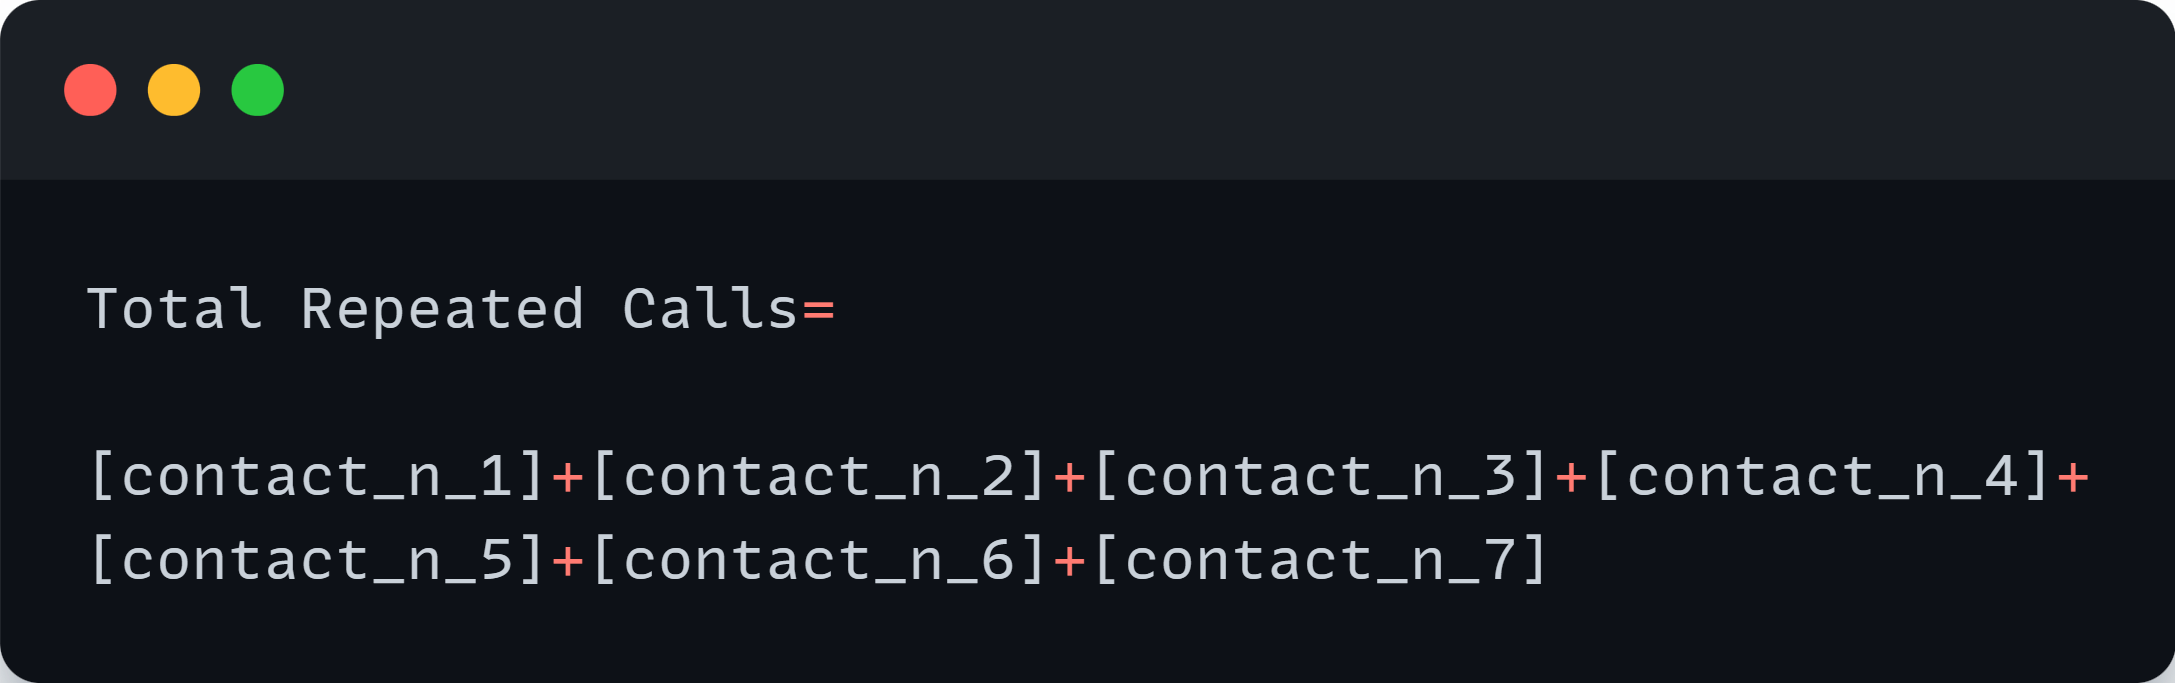
- Create Calculated Fields:
Generate calculated fields such as "Total repeated calls" by aggregating 'contact_n_#' columns.
- Visualizations - Day 0 Calls and Repeat Calls:
Create a dual-axis chart showing day 0 calls and repeat calls by market type.
- Visualizations - Total Repeated Calls by Type:
Design visuals illustrating total repeated calls by type, including pie charts and column charts.
- Apply Filters:
Apply filters based on month and day to analyze data across different time periods.
- Tooltip Formatting:
Enhance visualization clarity by formatting tooltips to provide additional context and insights.
Analysis Findings:
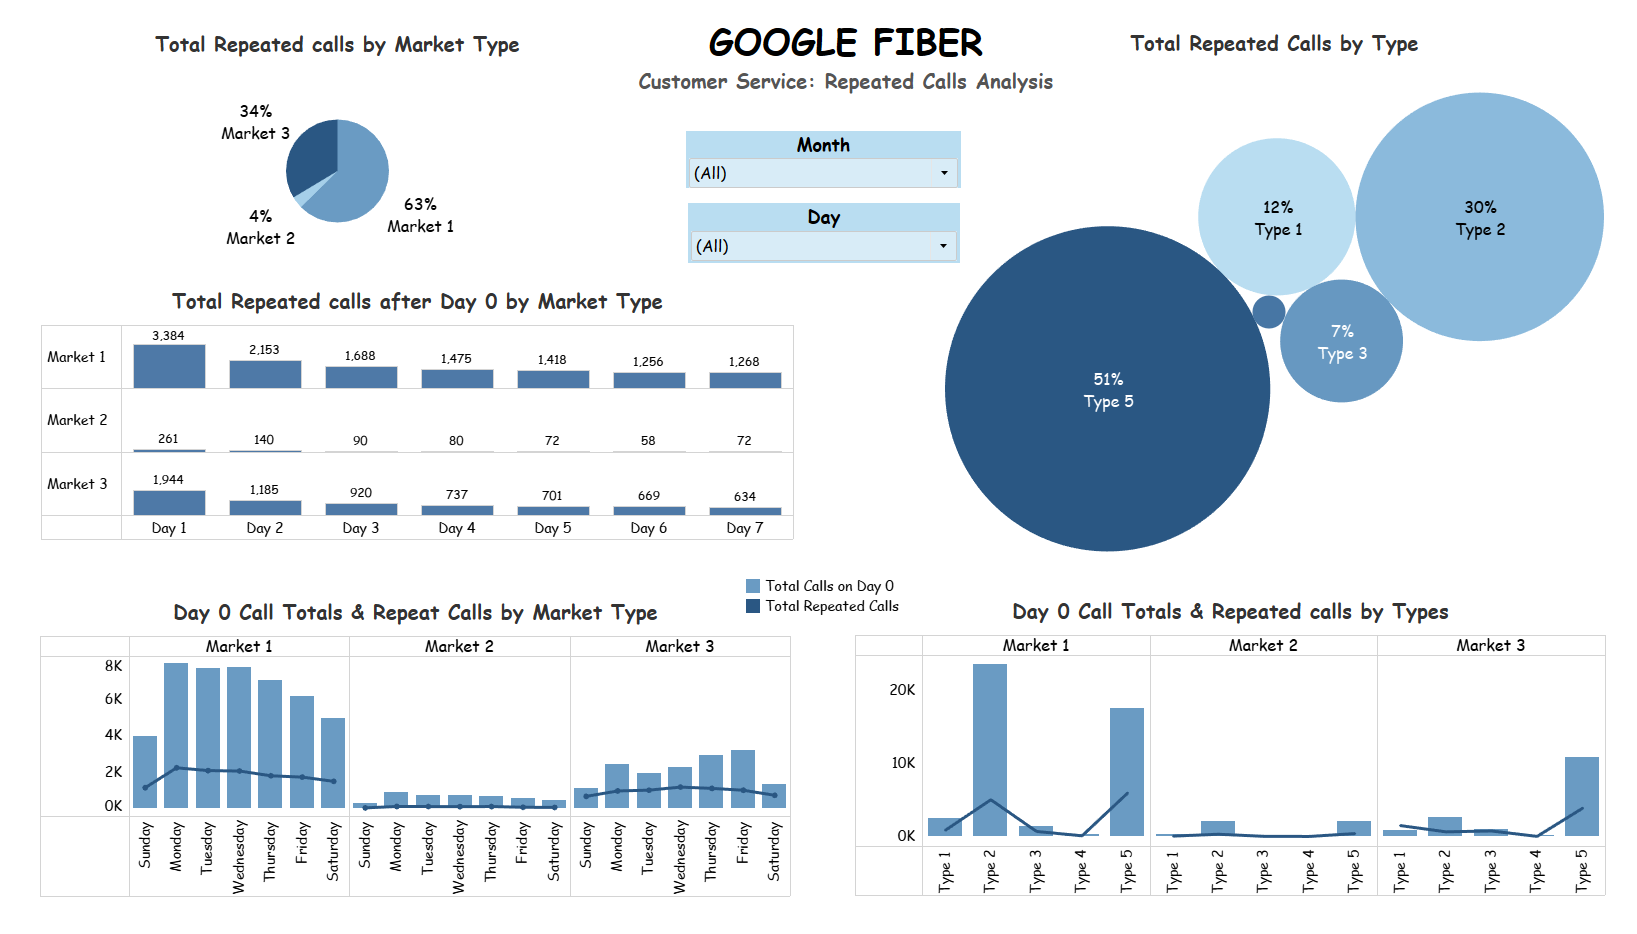
- Market-wise Distribution of Repeated Calls:
Market 1 received the highest percentage of repeated calls.
- Distribution of Repeated Calls by Issue Type:
Type 5 (Internet and WiFi issues) received the highest percentage of repeated calls.
- Prevalence of Repeated Calls Across Markets:
Types 2 (Technician Troubleshooting) and 5 (Internet and WiFi) consistently experienced the highest volume of repeated calls.
- Timing of Repeated Calls:
The majority of repeated calls occurred on day 1, following the initial contact (day 0).
- Day-wise Distribution of Repeated Calls:
Market 1 and Market 2 experienced the highest volume of repeated calls on Mondays.
- Tools Tableau and Excel
- Go to Github!
- Go to Dashboard!