Introduction
In this project, I delved into a weather dataset using Python, focusing on data preparation, correlation analysis, and regression analysis. Main goals were to clean and preprocess the data, uncover relationships between various weather parameters through correlation analysis, and utilize regression analysis to predict one weather parameter based on others. Additionally, a dynamic dashboard to analyze weather trends on both monthly and daily scales was developed. Notably, this dataset consisted of a substantial 2.25 million rows, presenting a rich source of information for the analysis.
Objective
| Data Cleaning and Preprocessing: | Handled missing values, outliers, and inconsistencies in the dataset using Pandas and NumPy libraries. |
| Statistical Analysis: | Conducted statistical summary and basic exploratory data analysis to understand the dataset's characteristics. |
| Data Visualization: | Created visualizations using Seaborn and Matplotlib libraries to explore patterns and distributions in the data. |
| Correlation Analysis: | Identified relationships between different weather parameters using correlation coefficients. |
| Regression Analysis: | Implemented linear regression to predict one weather parameter based on others and interpreted the regression coefficients. |
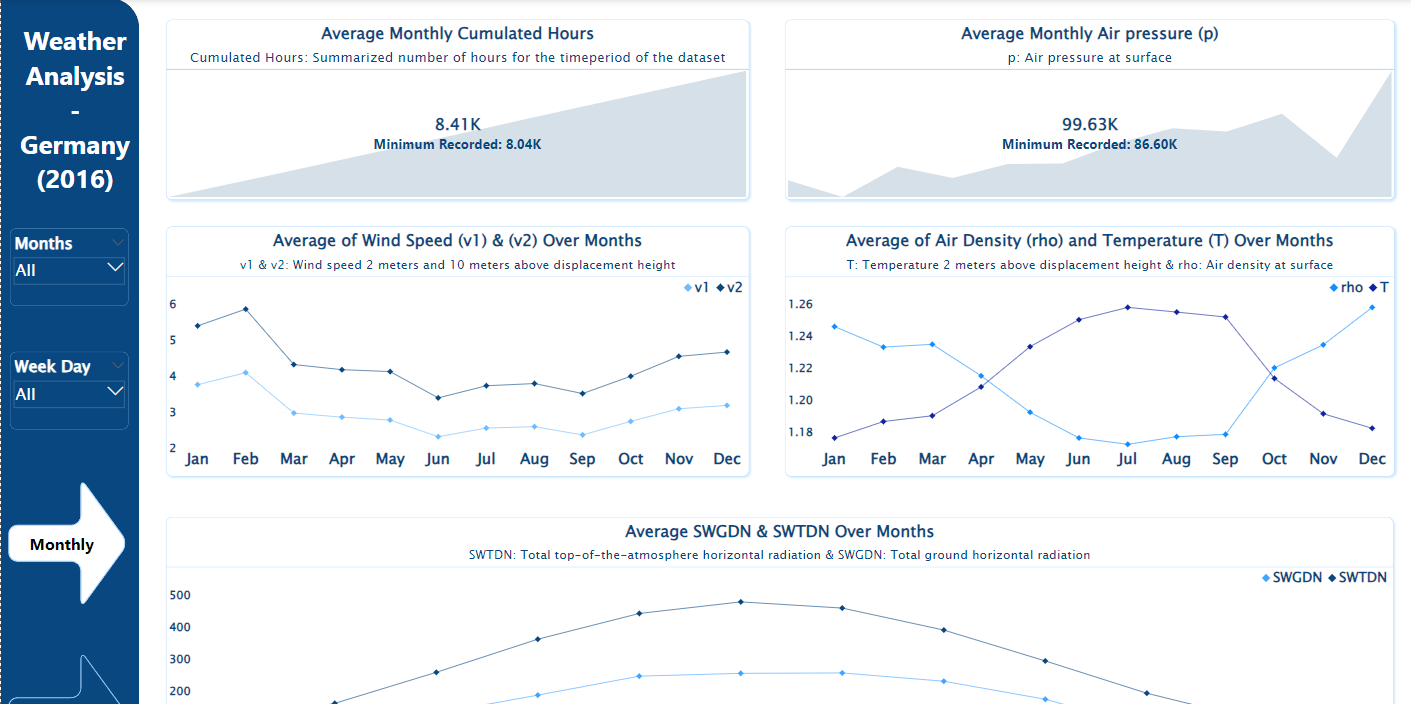
| Dynamic Dashboard using Power BI: | Developed a dynamic dashboard using Power BI to show trends and patterns of weather dataset on a monthly and weekly basis. |
Methodology
Data Preparation:
- Cleaned the weather dataset by handling missing values, outliers, and whitespaces in column names.
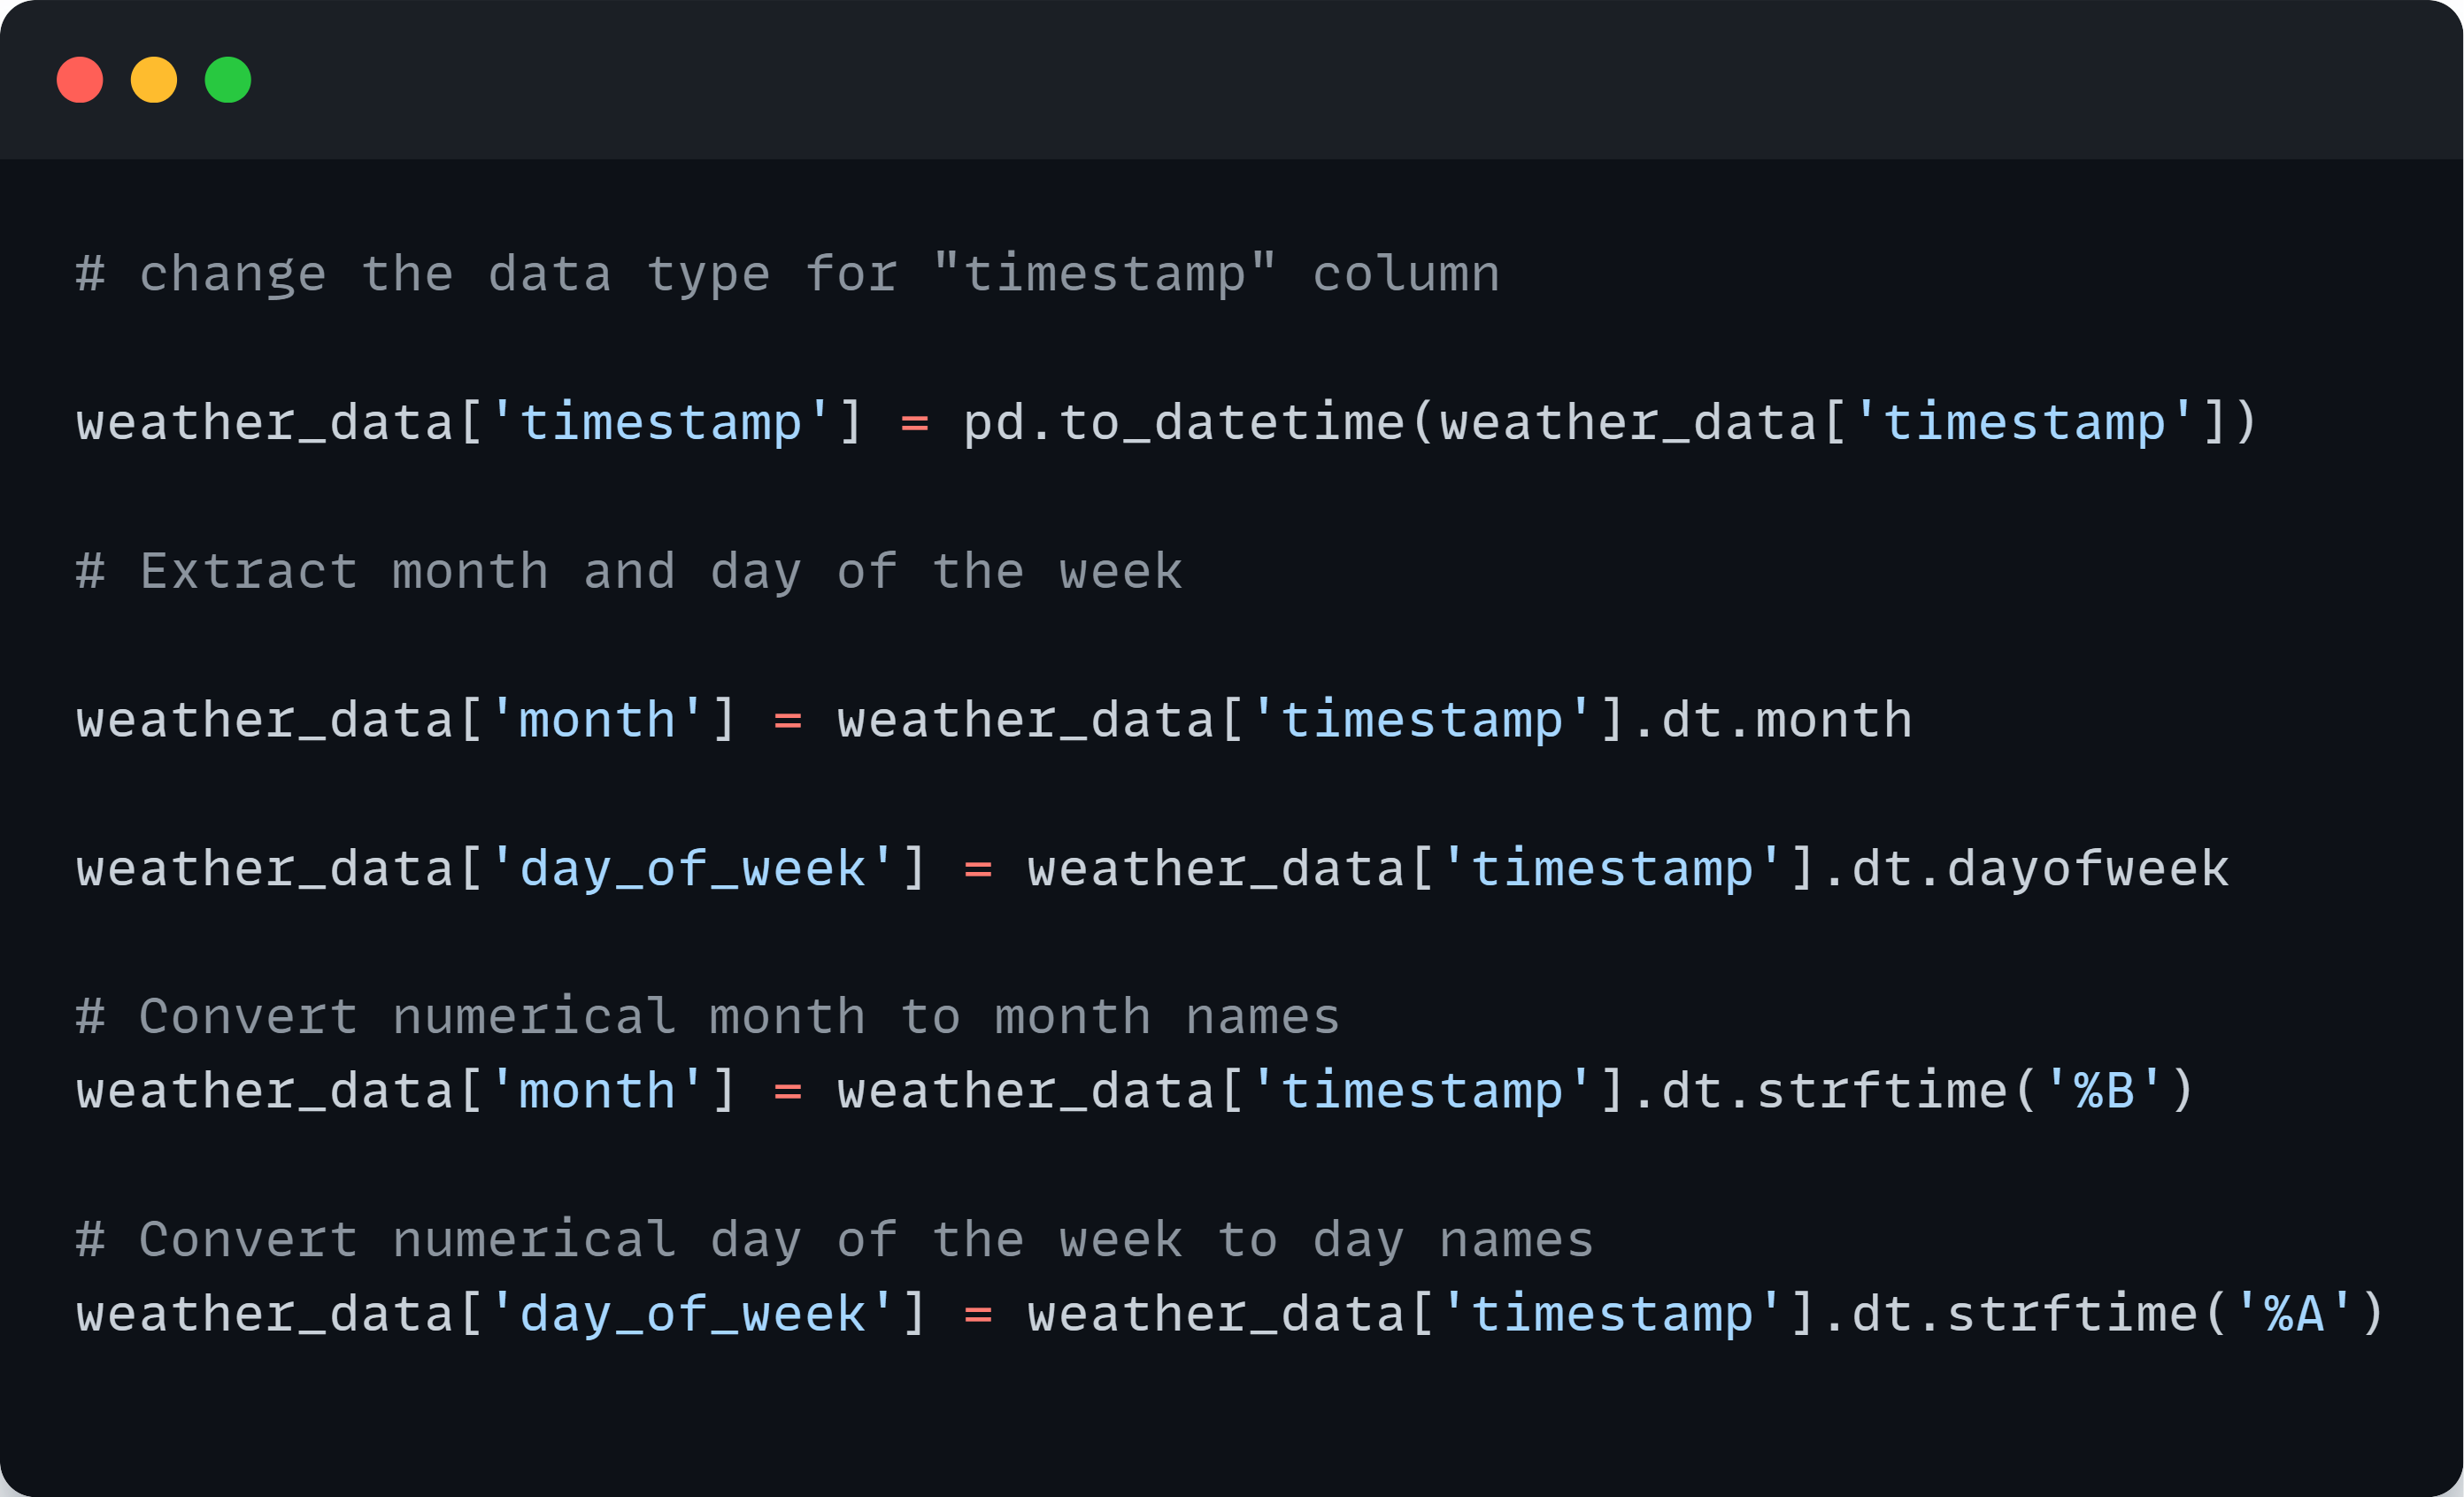
- Changed the data type of the timestamp column and extracted month and day of the week from the timestamp.
- Conducted statistical summary and created visualizations to understand the dataset's characteristics.
Correlation Analysis:
- Identified relationships between different weather parameters through correlation analysis.
- Analyzed the correlation coefficients between wind speeds, heights above ground, roughness length, solar radiation, temperature, air density, and pressure.
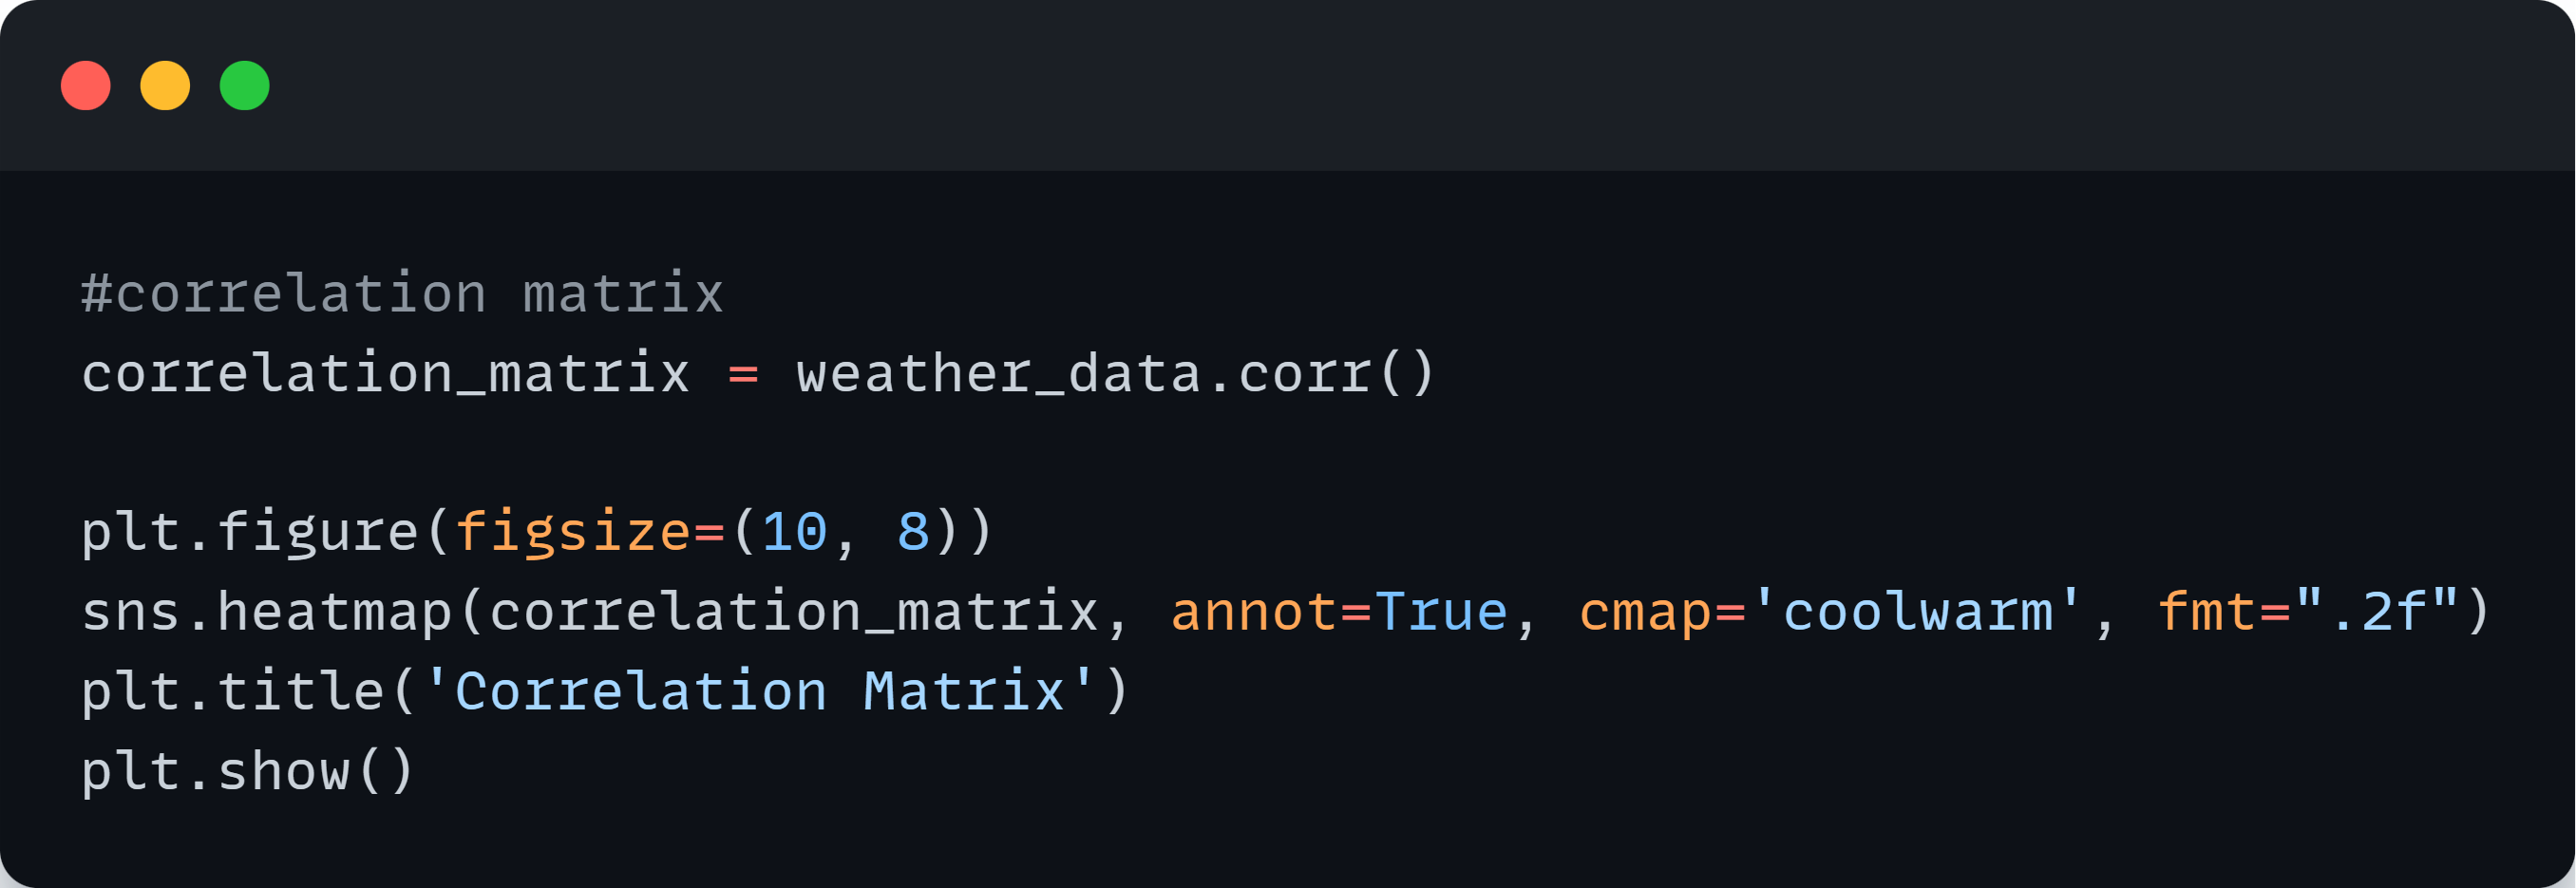
- Visualized the correlation matrix using heatmaps to visualize the strength and direction of correlations.
Regression Analysis:
- Implemented linear regression to predict wind speed ('v1') based on other weather parameters.
- Evaluated the model's performance using cross-validation scores and interpreted the regression coefficients.
- Derived insights into the predictors' influence on predicted wind speed and discussed limitations and considerations.

Data Manipulation and Transformation in POWER BI:
-
Changing Data Types:
Adjusted all column data types for consistency.
-
Extracting Additional Information:
Created new columns for:
- Month Name (as "month_extracted").
- Month Number.
- Day of the Week Name (as "week_day_extracted").
- Day of the Week Number (as "week_day_number").
This step ensures proper ordering even if month and day names are not consistently arranged.
Data Visualization:
-
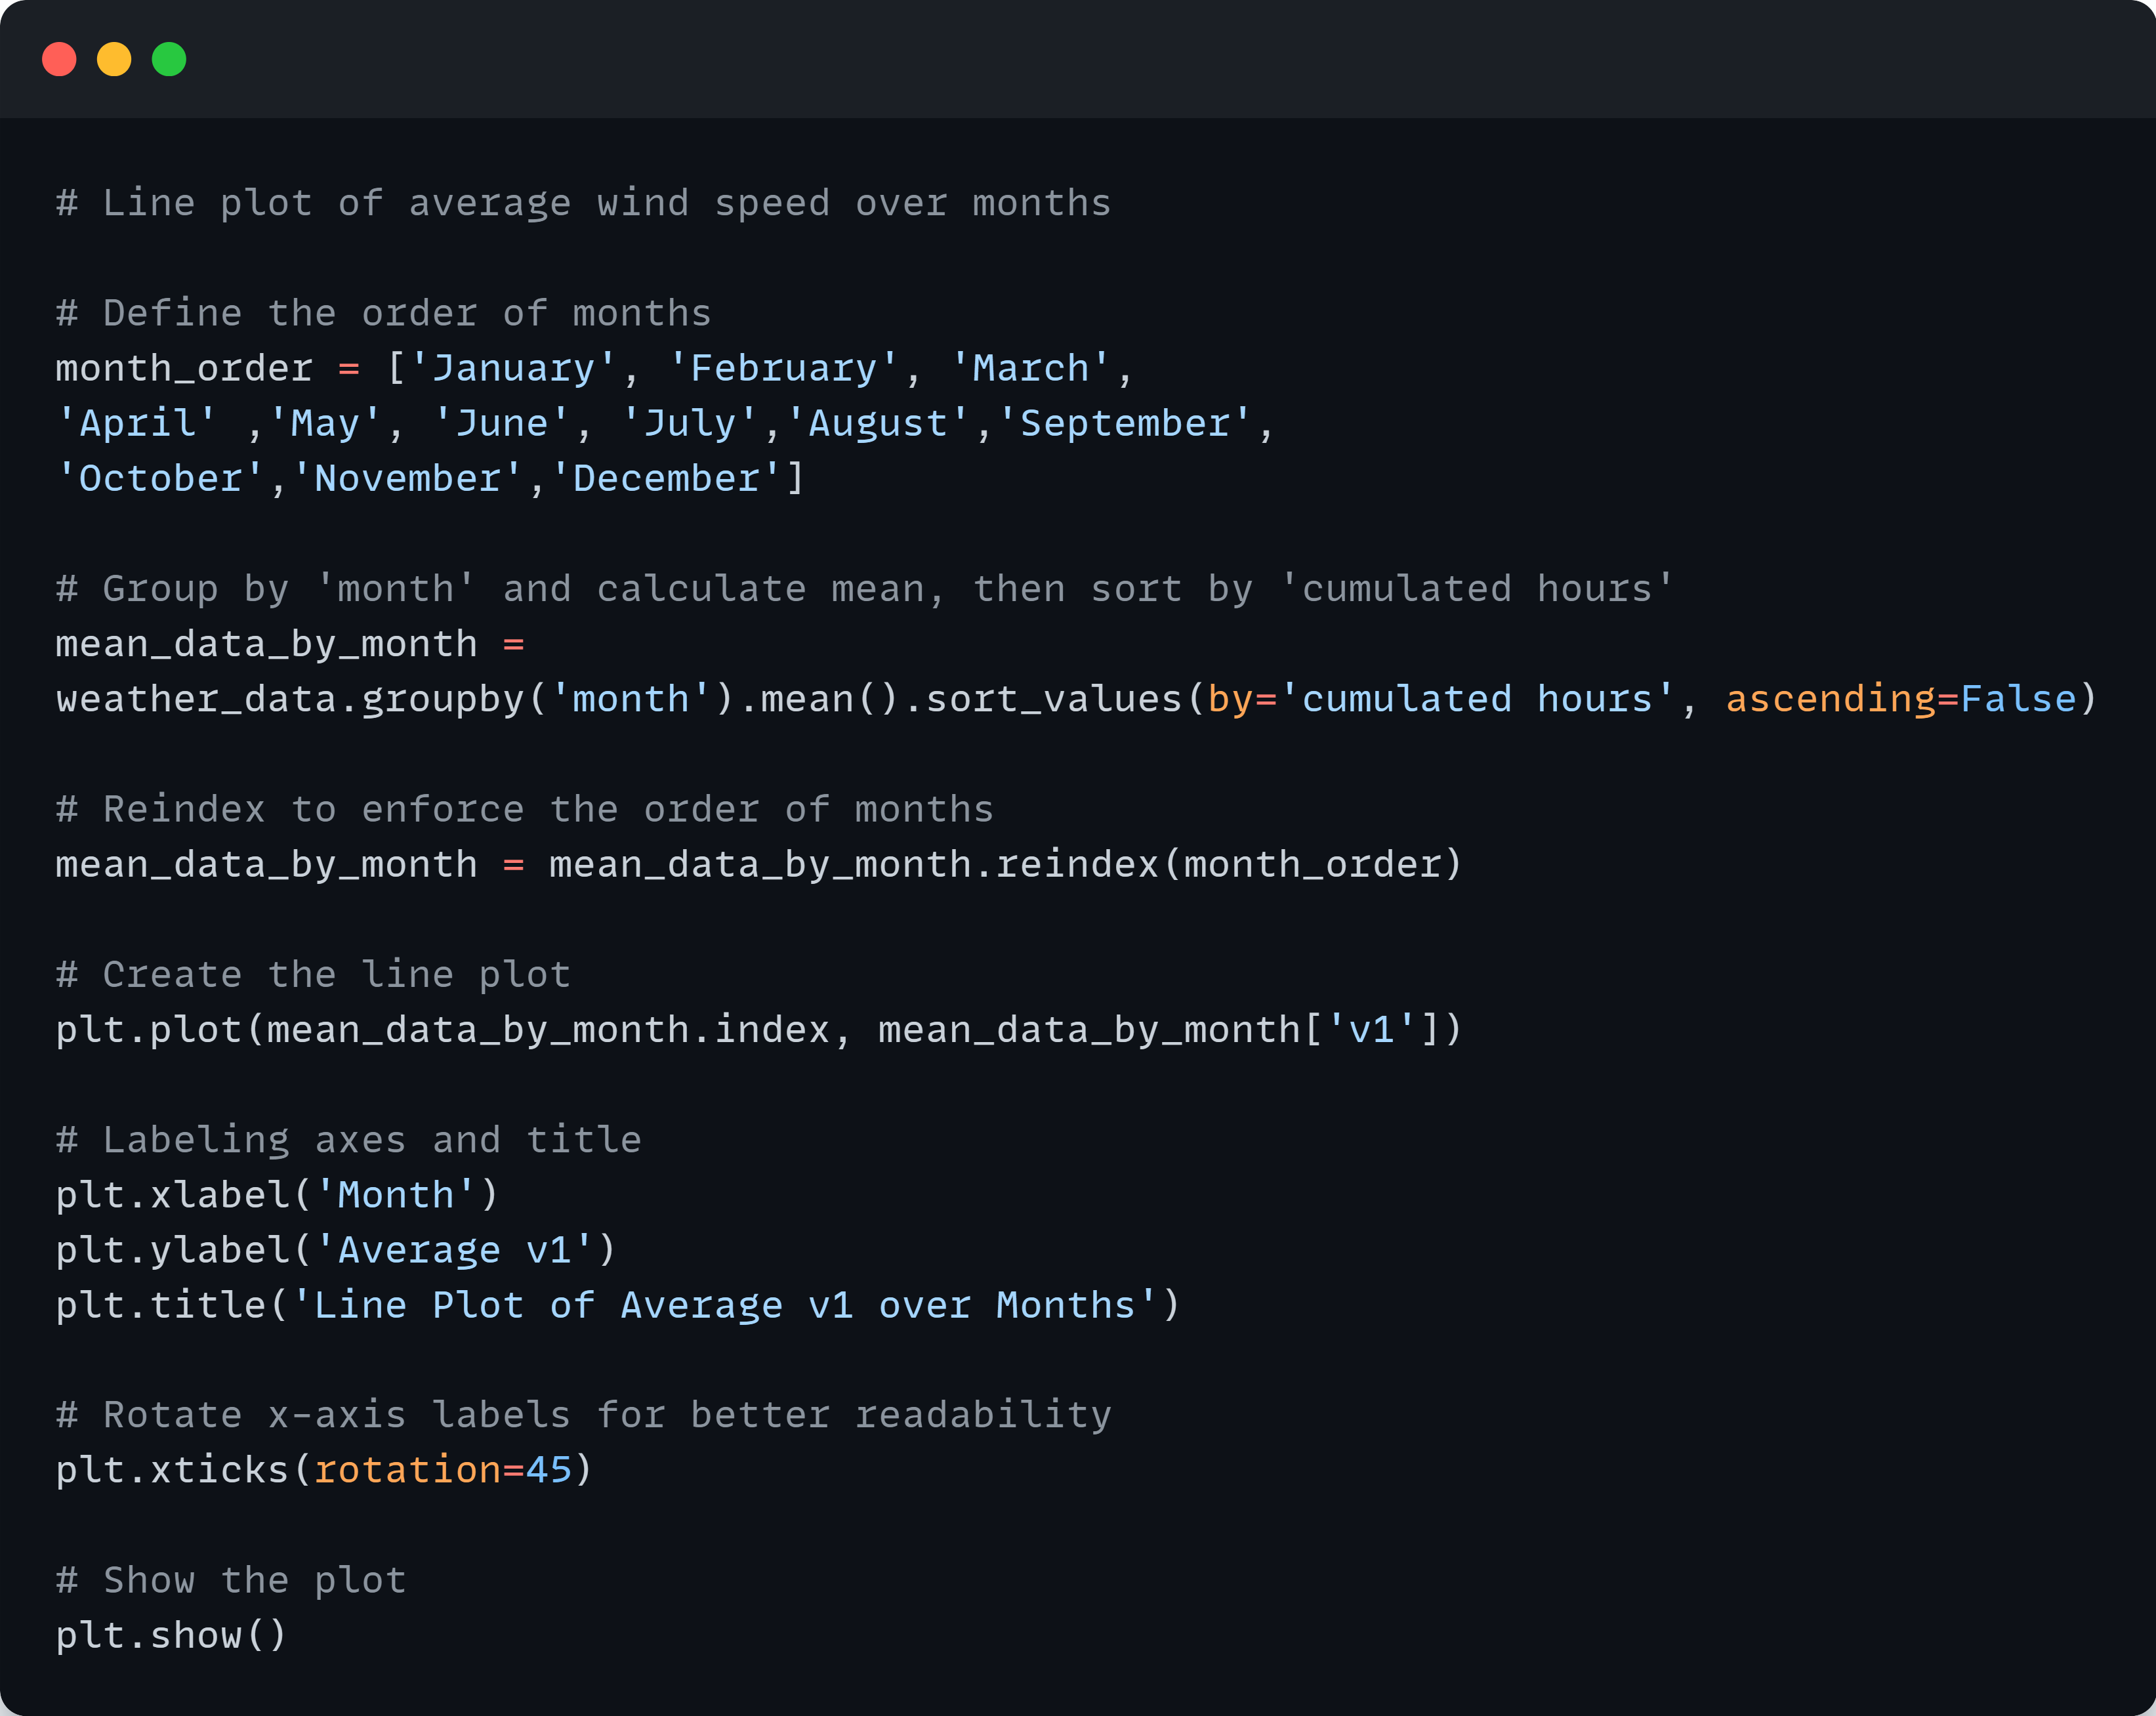
Average Wind Speed Over Months:
- Utilized a line chart to visualize average wind speeds.
- Placed "month_extracted" on the x-axis.
- Sorted months correctly by selecting "sort by column" and choosing the "month number".
- Similar Visualization for Other Parameters:
Employed line charts for other metrics following the same process.
- Key Performance Indicators (KPIs):
Configured KPIs by:
- Adding "cumulated hours" to values.
- Averaging the values.
- Setting "month_extracted" as the trend axis.
- Utilizing the minimum of "cumulated hours" as the target for comparison.
- Buttons for Navigation:
Inserted page navigation buttons under the "insert" tab, then "navigator", and finally "page navigator".
- Slicers for Filtering:
Incorporated slicers for filtering data by month and week days.
- Week Days Dashboard:
Duplicated the current page and replaced "month_extracted" with "week_day_extracted" to create a dashboard focused on weekdays.
- Slicer Sync Across Dashboards:
Ensured slicers are synchronized across both dashboards for seamless filtering by navigating to "view" and selecting "sync slicers". Then, selected all pages to apply the synchronization.
Results
Seasonal Variations:
Identified seasonal trends in wind speeds, solar radiation, and temperature, with higher values observed during summer months.
Height Above Ground and Roughness Length:
Found consistent values for heights above ground and roughness length throughout the year, indicating stable measurement conditions.
Correlation Analysis:
- Discovered strong positive correlations between wind speeds at different heights above ground and between solar radiation variables.
- Moderate correlations were observed between temperature, air density, and latitude.
Regression Analysis:
- The regression model demonstrated strong performance with high cross-validation scores.
- Predictor variables such as wind speed at 10 meters above displacement height ('v2') and air density ('rho') had significant positive coefficients, indicating their influence on predicted wind speed.
- Tools Python and PowerBI
- Go to Github!
- Go to Dashboard!